
Executive Summary
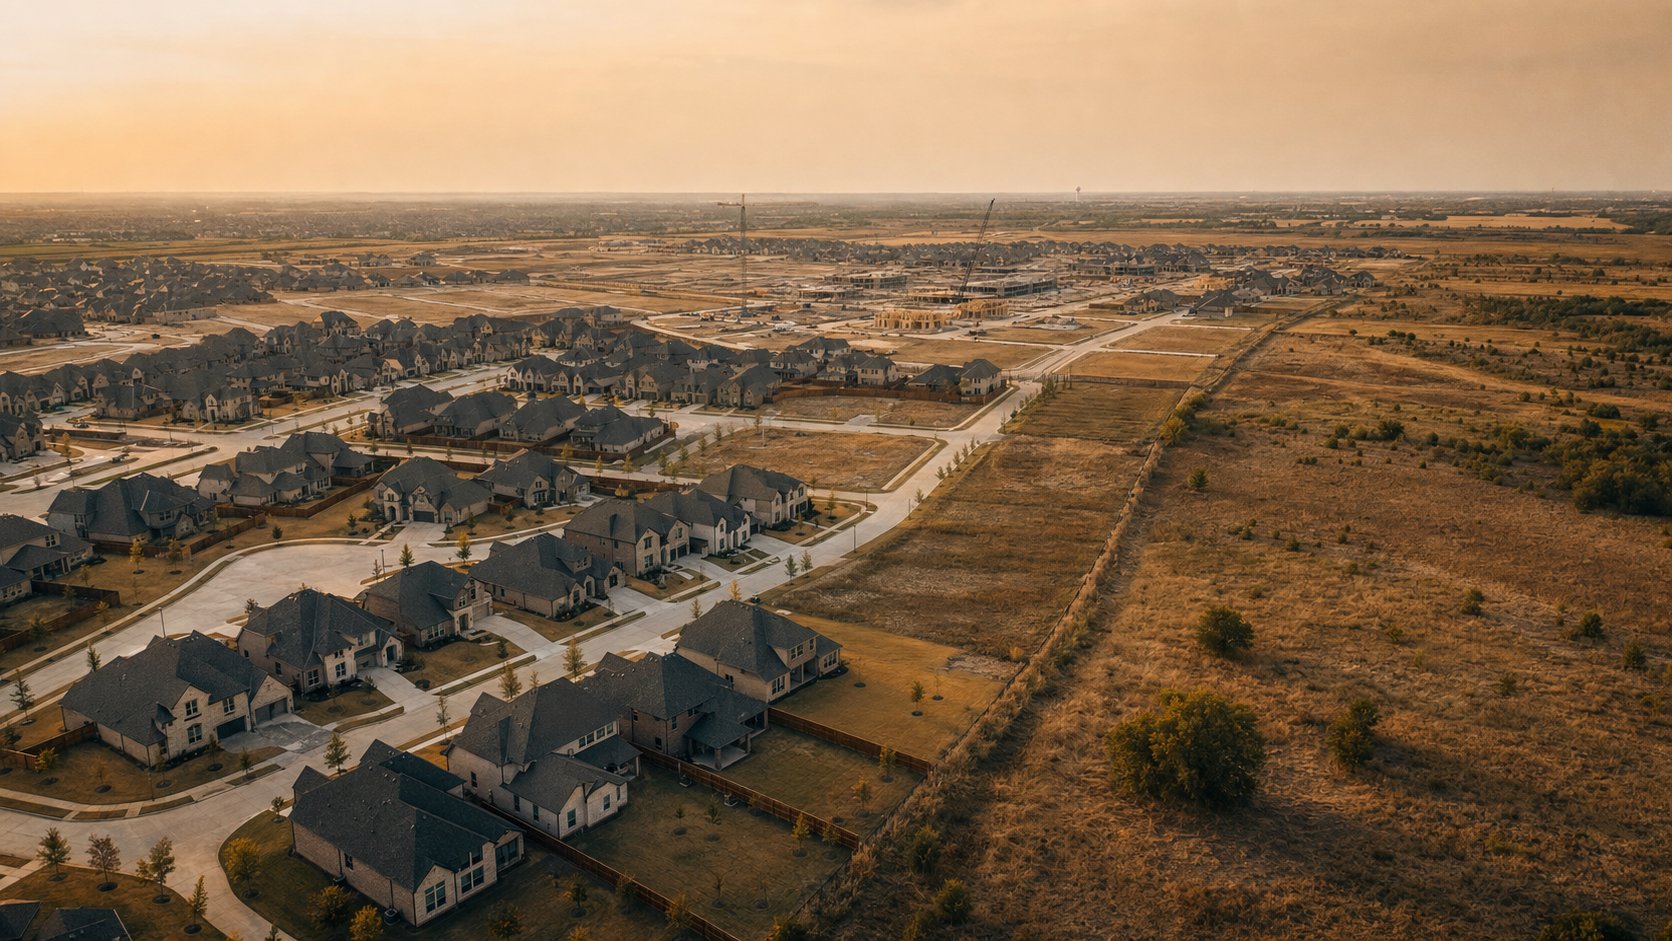
North Texas contains four of the fastest-growing cities in the United States. Celina, Texas grew 24.6 percent in a single year to a population of 64,427 in the Census Bureau’s Vintage 2025 estimates, the fastest growth of any U.S. city with more than 20,000 residents. Neighboring Princeton, Anna, and Melissa also appear near the top of the same list. Yet the same two-decade stretch that produced this boom also opened a gap between what North Texans earn and what they must pay for a home.
Between January 2005 and April 2025, the S&P CoreLogic Case-Shiller home price index for Dallas rose 156 percent. Median household income in Dallas County rose 74 percent over 2005 to 2023. Nationally, the ratio of median home price to median household income reached 5.0 in 2024, matching the record high set in 2022 and well above the pre-pandemic 4.1 (Joint Center for Housing Studies of Harvard University, 2025).
Key finding. The economic engine that drew millions to North Texas has produced the highest-cost single-family housing market in state history, and the affordability strain is not distributed evenly. Black home-purchase loan applicants were denied at 18.2 percent of applications in 2025, compared with 6.9 percent for White applicants (Urban Institute, 2026). This report presents twenty years of primary-source data and does not draw causal conclusions about why the gaps exist.
Twenty years of Census, Federal Reserve, and Harvard housing data show that North Texas grew faster than any comparable metro in the country. It also grew less affordable, and the affordability strain is uneven by race and income.
On May 14, 2026, the U.S. Census Bureau released its Vintage 2025 population estimates for U.S. cities. The list identified Celina, Texas as the fastest-growing city in the country with a population above 20,000, at 24.6 percent one-year growth to 64,427 residents (U.S. Census Bureau, 2026). One year earlier, the Vintage 2024 release had ranked Celina fourth nationally at 18.2 percent growth and 51,661 residents, behind Princeton, Texas at first place (U.S. Census Bureau, 2025). Princeton, Anna, and Melissa, all in Collin County north of Dallas, each appeared alongside Celina near the top of both years’ lists.
The Federal Reserve Bank of St. Louis, drawing on Census Bureau data, estimates the Dallas-Fort Worth-Arlington metropolitan area population at 8,353,600 as of July 2024 (Federal Reserve Bank of St. Louis, 2026a). If the current pace holds, the region will pass Chicago as the third-largest metro in the United States within the next census cycle.
Growth of this speed reshapes housing markets, and the twenty-year record makes the shift measurable. This report compares 2005 and 2025 data on population, home prices, household income, mortgage lending, and insurance costs across four bands of North Texas cities: the far-north growth belt (Celina, Prosper, Frisco, McKinney), the inner-ring suburbs (Plano, Allen, Irving), the twin urban cores (Dallas, Fort Worth) and the mid-sized adjacent markets (Arlington, Grand Prairie, Denton).
Twenty Years of Growth
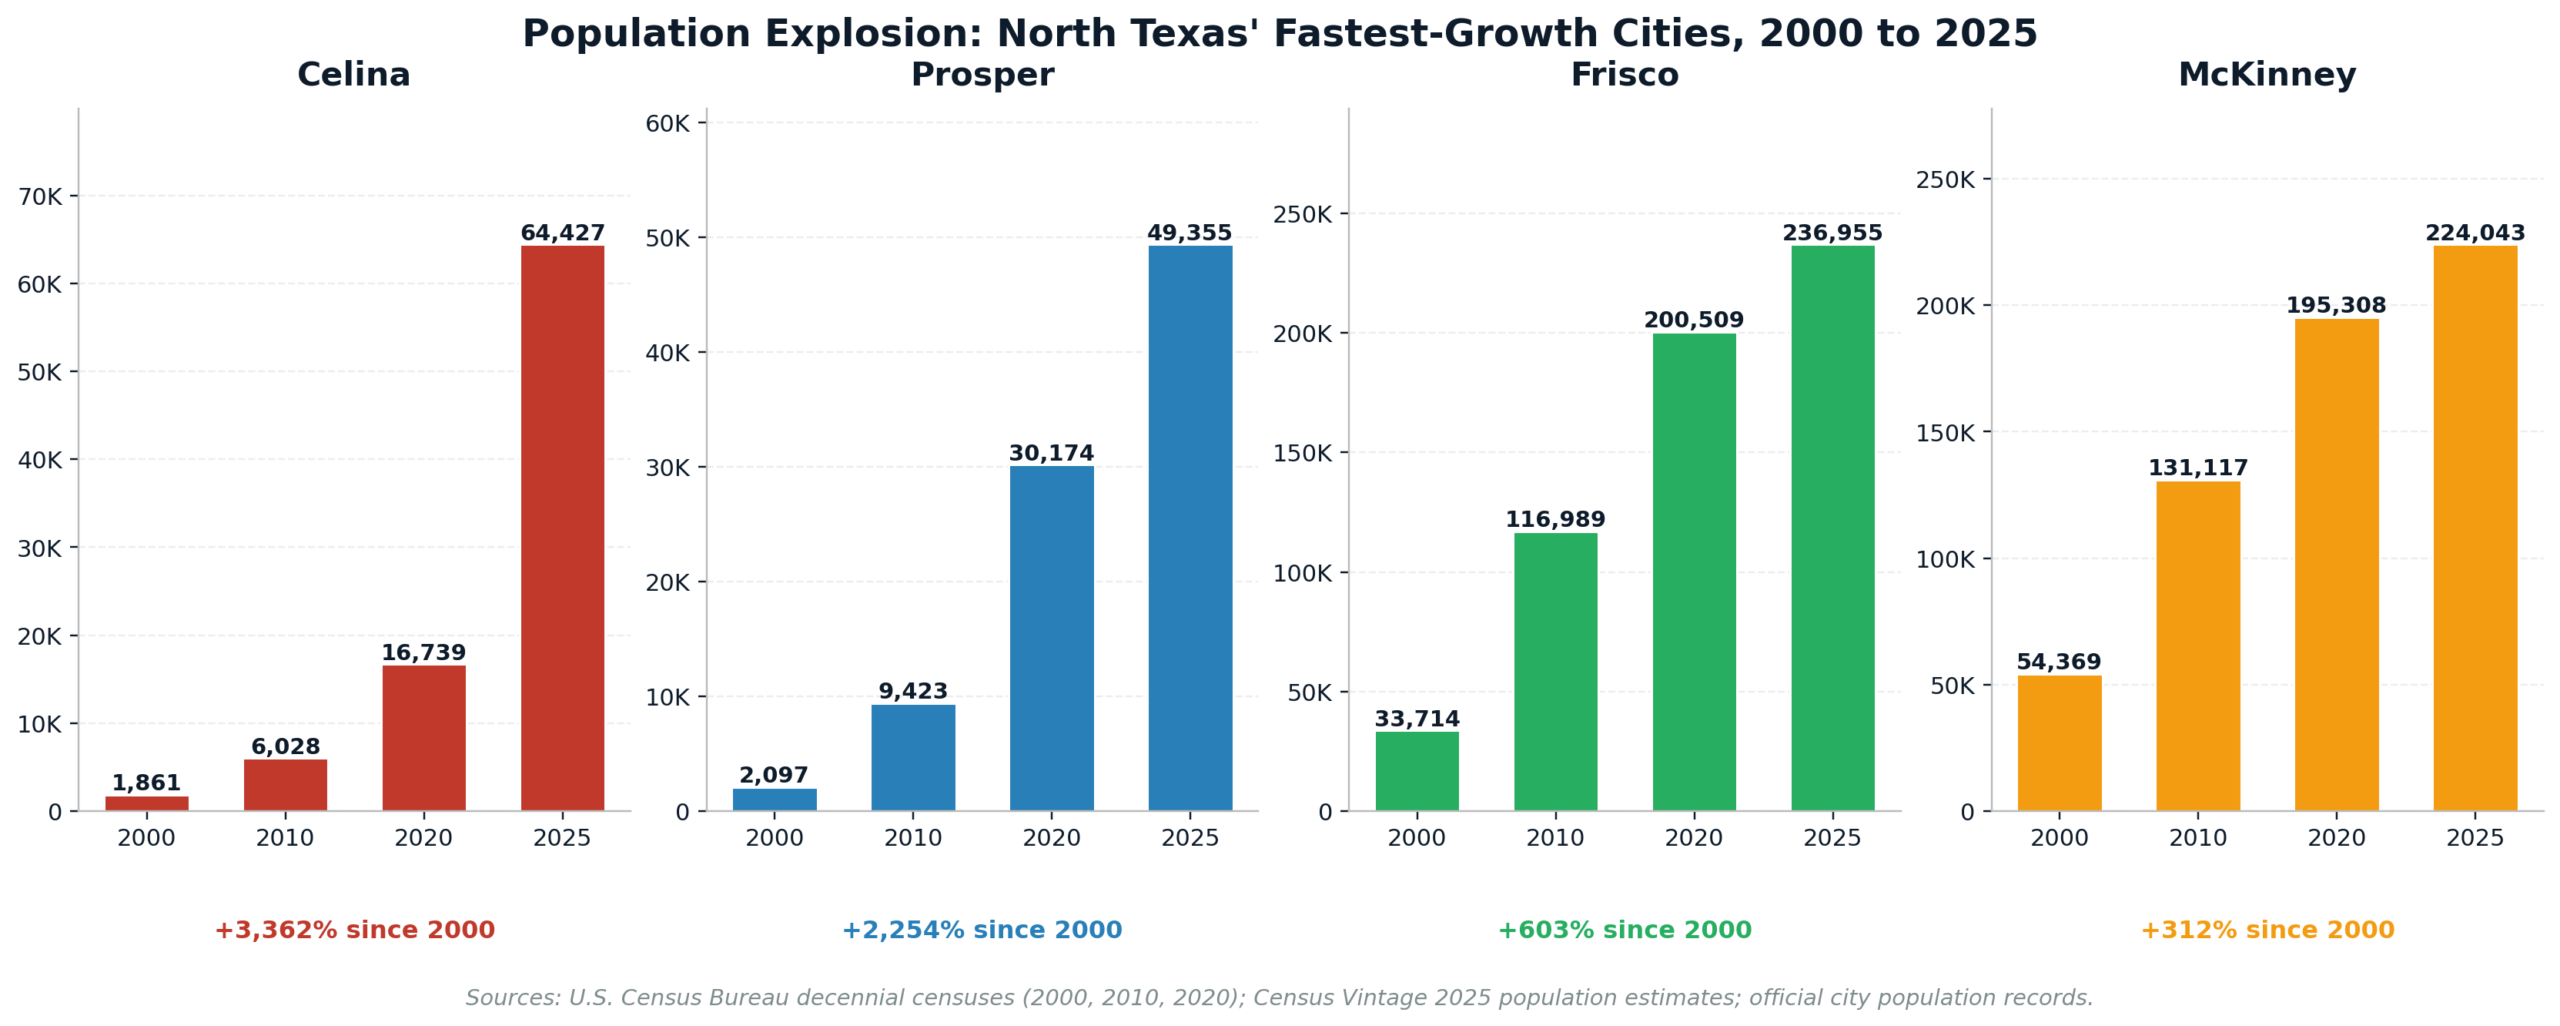
In 2000, Celina had 1,861 residents. It was a farming community north of the Dallas-Fort Worth built environment, best known for its high school football program. Prosper had 2,097 residents. Frisco had 33,714, still small by Texas standards. McKinney had 54,369 and was already the county seat of Collin County (U.S. Census Bureau, 2020).
Twenty-five years later the same four cities look nothing like they did. Celina reported 64,427 residents in the Census Bureau’s Vintage 2025 population estimates, an increase of more than 3,300 percent since 2000. Prosper reported approximately 49,355 as of January 2026 per the town’s own records. Frisco is estimated near 236,955 in Vintage 2025 tabulations, and McKinney reached 224,043 according to its city government records (City of Prosper, 2026; City of McKinney, 2025).
Growth of this magnitude does not happen by accident. The Texas Comptroller’s Housing Affordability Gap report attributes the region’s expansion to three overlapping economic forces: corporate relocations, no state income tax, and comparatively low land costs at the periphery of the built area (Texas Comptroller of Public Accounts, 2024). Between 2016 and 2024, Toyota, Charles Schwab, Jacobs Engineering, McKesson, JPMorgan Chase, and CBRE moved or expanded major operations to the region. The Dallas Regional Chamber reports that Dallas-Fort Worth added 170,396 residents between July 2021 and July 2022 alone, a 2.2 percent annual rate more than four times the national average (Dallas Regional Chamber, 2024).
The pace of housing construction rose to meet the demand. The Texas Comptroller’s affordability analysis notes that Texas remained the leading state for single-family building permits during the recent expansion, yet supply has not been enough to hold prices flat (Texas Comptroller of Public Accounts, 2024).
Prices, Paychecks and the Widening Gap
The S&P CoreLogic Case-Shiller Home Price Index for Dallas sat at 116.39 in January 2005, using a January 2000 base of 100 (Federal Reserve Bank of St. Louis, 2026b). By April 2025 the same index stood at 297.98, an increase of 156 percent over the twenty-year span. The index measures repeat sales of the same properties and is considered the most reliable long-run measure of local home price movement.
Household incomes in the Dallas core rose during the same period, but not at the same speed. Census Small Area Income and Poverty Estimates place median household income in Dallas County at 42,791 dollars in 2005. By 2023 the figure had reached 74,352 dollars, an increase of 74 percent (Federal Reserve Bank of St. Louis, 2026c). Indexed to the same 2005 baseline as the Case-Shiller series, incomes rose by 74 points while home prices rose by 145 points through 2023, a gap of 71 index points at the latest income-year available. When April 2025 home-price data is used, the gap widens further.
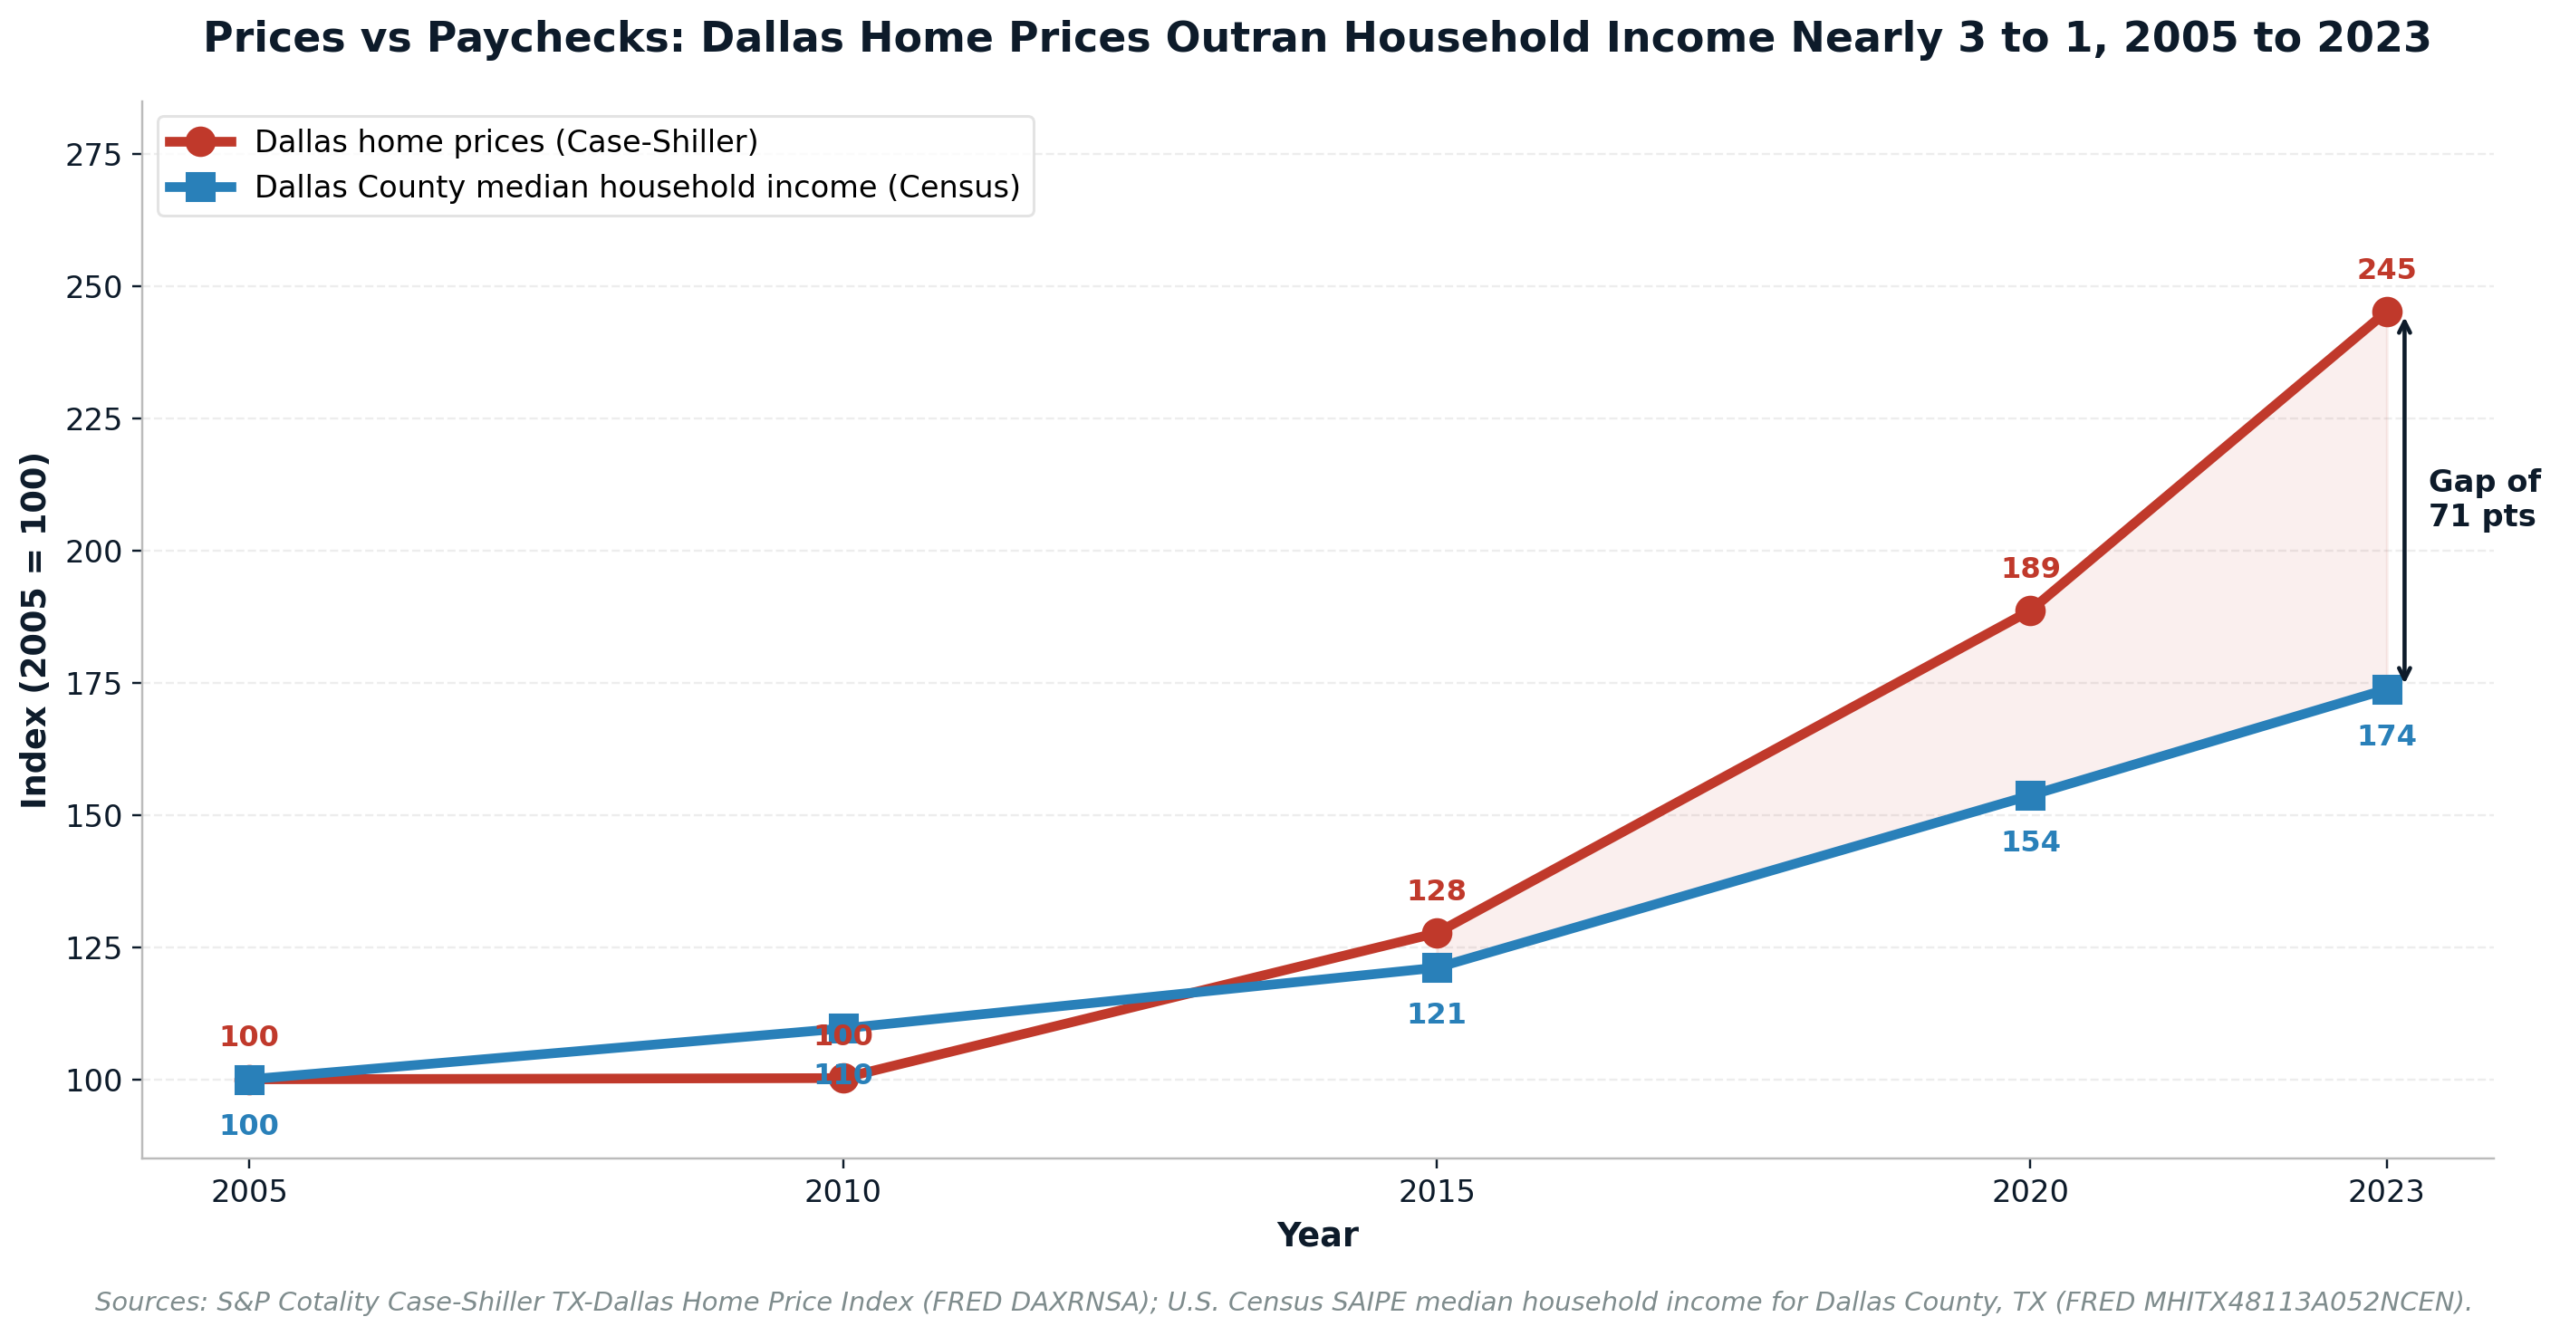
The result is a housing market where earnings no longer keep pace with the price of what earnings are meant to buy. In its 2025 State of the Nation’s Housing report, the Joint Center for Housing Studies of Harvard University found that the national ratio of median home price to median household income reached 5.0 in 2024, matching the record set in 2022 and rising from a pre-pandemic 4.1 in 2019 (Joint Center for Housing Studies, 2025).
The Harvard report also quantifies what an entry-level buyer now needs. A first-time homebuyer requires an annual income of at least 126,700 dollars to afford payments on the median-priced U.S. home of 412,500 dollars, assuming a 31 percent housing debt-to-income ratio and a 30-year mortgage with a 3.5 percent down payment. Only about one in seven U.S. renter households, or 6 million out of 46 million, earns enough to meet that threshold (Joint Center for Housing Studies, 2025). Homes.com listings data placed the median single-family home price in Dallas-Fort Worth at 415,000 dollars in the twelve months ending May 2026, close to the national median (Homes.com, 2026).
The economic context. The Dallas Federal Reserve Bank’s Southwest Economy publication reported in 2026 that the median Texas homeowner paid 60 percent more for home insurance in 2024 compared with 2019, one of the largest increases in the country. Dallas-Fort Worth and Amarillo carry the highest insurance burdens of any Texas metropolitan area (Federal Reserve Bank of Dallas, 2026). Insurance is not counted in the Case-Shiller price index. When it is added to a monthly ownership cost, the effective affordability gap grows larger than the home-price data alone suggests.
The Denial Gap
Aggregate price and income figures describe the market average. They do not describe the experience of applying for a mortgage. The Home Mortgage Disclosure Act, enacted in 1975, requires most lenders to report application-level data on race, ethnicity, income, loan amount, and outcome. The Urban Institute’s Housing Finance Policy Center publishes ongoing analysis of the resulting dataset. Its 2026 review of the 2025 HMDA data found that home-purchase mortgage applications from Black borrowers were denied at 18.2 percent, compared with 6.9 percent for White borrowers, 9.7 percent for Asian borrowers, and 12.1 percent for Hispanic borrowers (Urban Institute, 2026).
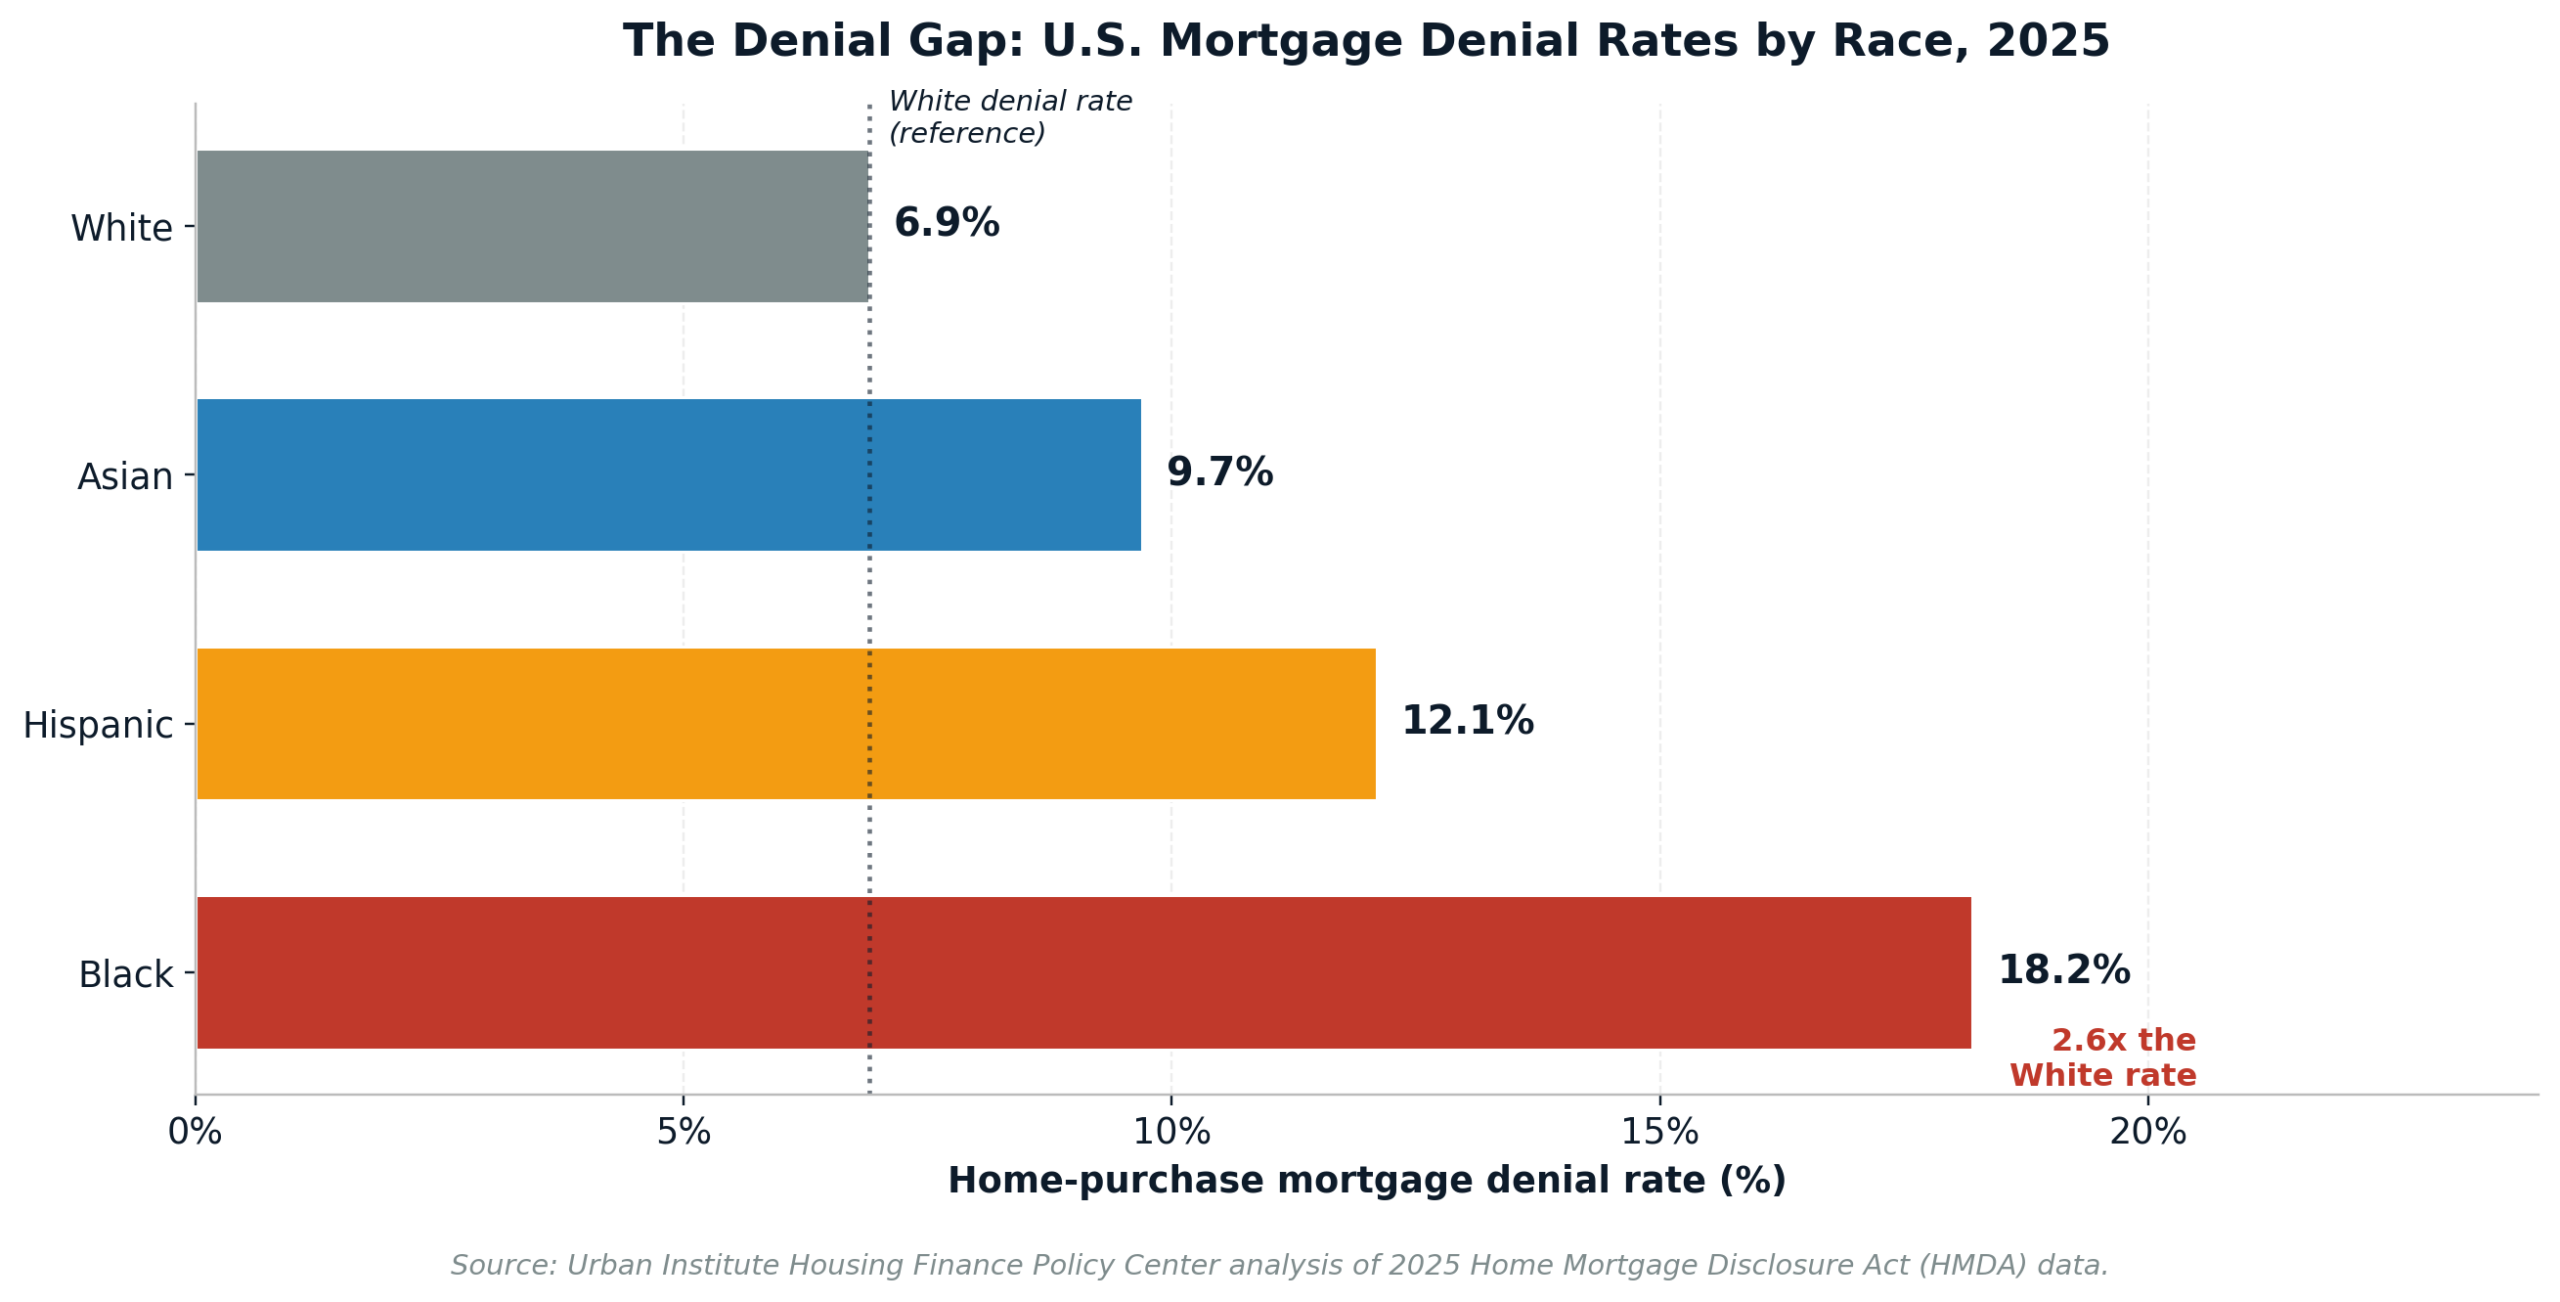
Denial rates capture only one part of the lending pipeline. Zillow’s 2026 analysis of HMDA data found that in every one of the 50 largest U.S. metropolitan areas, Black applicants were denied home-purchase loans at higher rates than White applicants (Zillow Research, 2026). San Antonio, Texas showed one of the largest gaps in the country at 18.6 percentage points. The Zillow analysis did not report city-level data for Dallas-Fort Worth in the same format, and this report does not extrapolate from other metros.
Homeownership outcomes reflect the cumulative effect. The Harvard Joint Center reports that the U.S. homeownership rate fell 0.3 percentage points in 2024 to 65.6 percent, the first annual decline in eight years, and continued falling to 65.1 percent in the first quarter of 2025. The rate among households under age 35 dropped 1.4 percentage points to 37.1 percent (Joint Center for Housing Studies, 2025). The gap between White and Black homeownership rates remained at 27.7 percentage points in 2024 according to the same report.
What the Data Does Not Say
HMDA data records outcomes, not intent. A higher denial rate for a group can reflect differences in credit history, debt-to-income ratio, down payment size, loan product mix, property location, appraisal outcome, or underwriting practices. The HMDA dataset does not include credit scores. The Urban Institute and the Consumer Financial Protection Bureau have published research examining these confounders, and both institutions have consistently found that measurable differences in applicant characteristics explain part but not all of the denial gap (Urban Institute, 2026; Consumer Financial Protection Bureau, 2023).
This report does not claim that the residual gap is caused by discrimination in any particular lender or by any single mechanism. It records that the gap is present, that it has been present in every HMDA reporting cycle for which comparable data exists, and that in the largest metropolitan areas in the country the pattern is universal. Readers seeking causal analysis should consult the peer-reviewed literature cited in the references.
What to Watch
Three data series will indicate whether the North Texas gap widens or narrows over the next decade.
- Building permits versus household formation. The Texas Real Estate Research Center at Texas A&M University publishes monthly permit data for the DFW MSA. Sustained permit issuance above household formation rates would, over time, moderate price growth in the outer suburbs.
- Case-Shiller Dallas and Dallas County income. If the Case-Shiller Dallas index rises faster than Dallas County median household income for another two annual cycles, the ratio of the two will surpass the national average that the Harvard Joint Center calls a record.
- Denial rate gap. The Urban Institute’s ongoing HMDA analysis is the clearest measure of whether lending outcomes for Black and Hispanic applicants converge with those for White applicants or continue to diverge.
Bottom line. Twenty years of primary-source data show that North Texas grew faster than any comparable region in the United States and produced housing costs that rose roughly twice as fast as household incomes. National mortgage lending data document a persistent racial gap in home-purchase denial rates, present in every one of the 50 largest metropolitan areas. The data do not resolve the causes of that gap. They record its presence, its scale, and its resistance to change.
References
City of McKinney. (2025). Population history for the City of McKinney, TX, 1900 to 2026. https://www.mckinneytexas.org/DocumentCenter/View/34111/Population-History-Table-and-Graph
City of Prosper. (2026). Stats and demographics. Town of Prosper, Texas. https://www.prospertx.gov/302/Stats-Demographics
Consumer Financial Protection Bureau. (2023). Data point: 2022 mortgage market activity and trends. https://www.consumerfinance.gov/data-research/research-reports/data-point-2022-mortgage-market-activity-trends/
Dallas Regional Chamber. (2024). 2024 Dallas regional economic development guide: Talent and population. https://www.dallaschamber.org/wp-content/uploads/2024/03/EDG2024_Talent-Population.pdf
Federal Reserve Bank of Dallas. (2026, April 15). Texas homeowners pay high insurance costs, face rising premiums. Southwest Economy. https://www.dallasfed.org/research/swe/2026/swe2609
Federal Reserve Bank of St. Louis. (2026a). Resident population in Dallas-Fort Worth-Arlington, TX (MSA) [DFWPOP]. FRED. https://fred.stlouisfed.org/series/DFWPOP
Federal Reserve Bank of St. Louis. (2026b). S&P CoreLogic Case-Shiller TX-Dallas home price index [DAXRNSA]. FRED. https://fred.stlouisfed.org/series/DAXRNSA
Federal Reserve Bank of St. Louis. (2026c). Estimate of median household income for Dallas County, TX [MHITX48113A052NCEN]. FRED. https://fred.stlouisfed.org/series/MHITX48113A052NCEN
Homes.com. (2026, May). Dallas-Fort Worth housing market report. https://www.homes.com/reports/dallas-fort-worth-housing-market/
Joint Center for Housing Studies of Harvard University. (2025). The state of the nation’s housing 2025. Harvard University. https://www.jchs.harvard.edu/state-nations-housing-2025
Texas Comptroller of Public Accounts. (2024, October). Housing affordability gap hits Texas. Fiscal Notes. https://comptroller.texas.gov/economy/fiscal-notes/economics/2024/aff-housing/
Urban Institute. (2026). New 2025 HMDA data reveal what it will take to make homeownership accessible. Housing Finance Policy Center. https://www.urban.org/urban-wire/new-2025-hmda-data-reveal-what-it-will-take-make-homeownership-accessible-and
U.S. Census Bureau. (2020). Decennial census of population, 2000, 2010, 2020. https://www.census.gov/programs-surveys/decennial-census.html
U.S. Census Bureau. (2025, May 15). Vintage 2024 subcounty population estimates [Press release]. https://www.census.gov/newsroom/press-releases/2025/vintage-2024-popest.html
U.S. Census Bureau. (2026, May 14). Vintage 2025 subcounty population estimates [Press release]. https://www.census.gov/newsroom/press-releases/2026/vintage-2025-city-town-pop-estimates.html
Zillow Research. (2026). Black-White mortgage denial gaps are widest where applicants are most financially stretched. Zillow Group. https://www.zillow.com/research/mortgage-denial-race-36446/