

Executive Summary
This report examines the ratio of sales and marketing expense to research and development expense across fourteen publicly traded cybersecurity and adjacent security-infrastructure companies. All figures are drawn directly from SEC XBRL company facts as reported on Forms 10-K and 20-F, using each company’s most recently completed fiscal year.
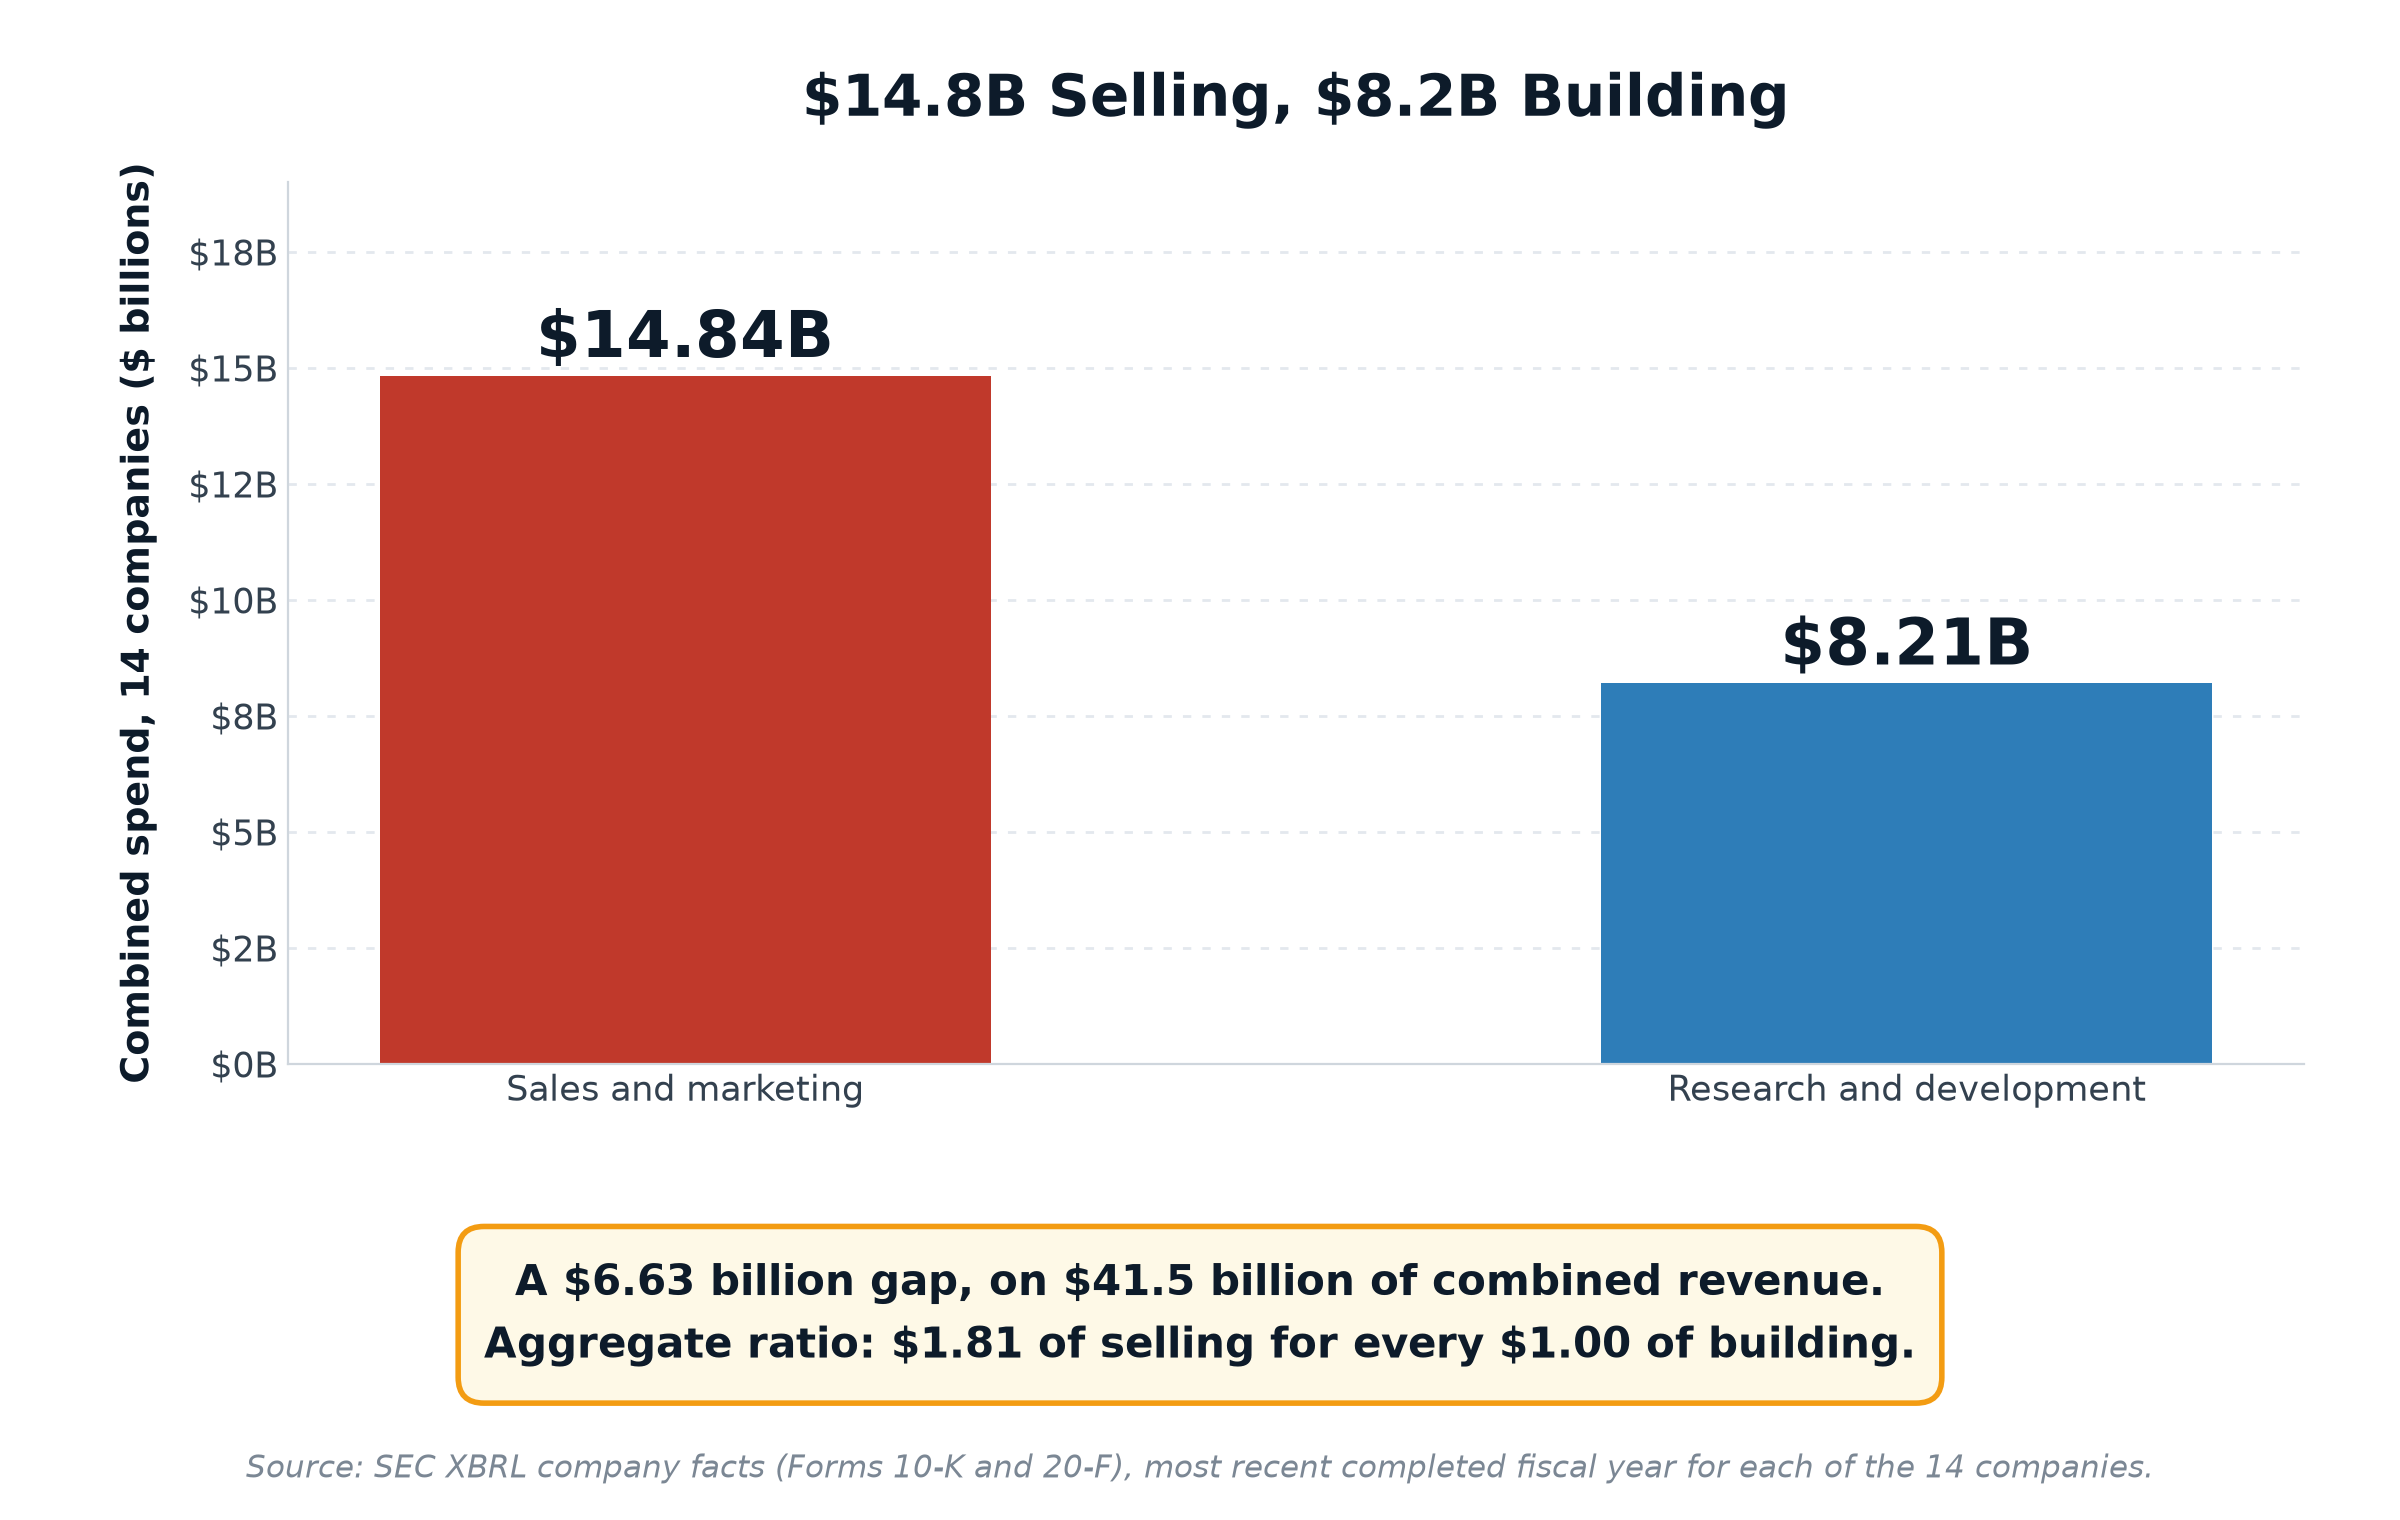
Across the fourteen, combined sales and marketing expense was $14.84 billion against $8.21 billion of research and development, on $41.5 billion of combined revenue. That is $1.81 spent reaching the customer for every $1.00 spent building the product, and a $6.63 billion gap.
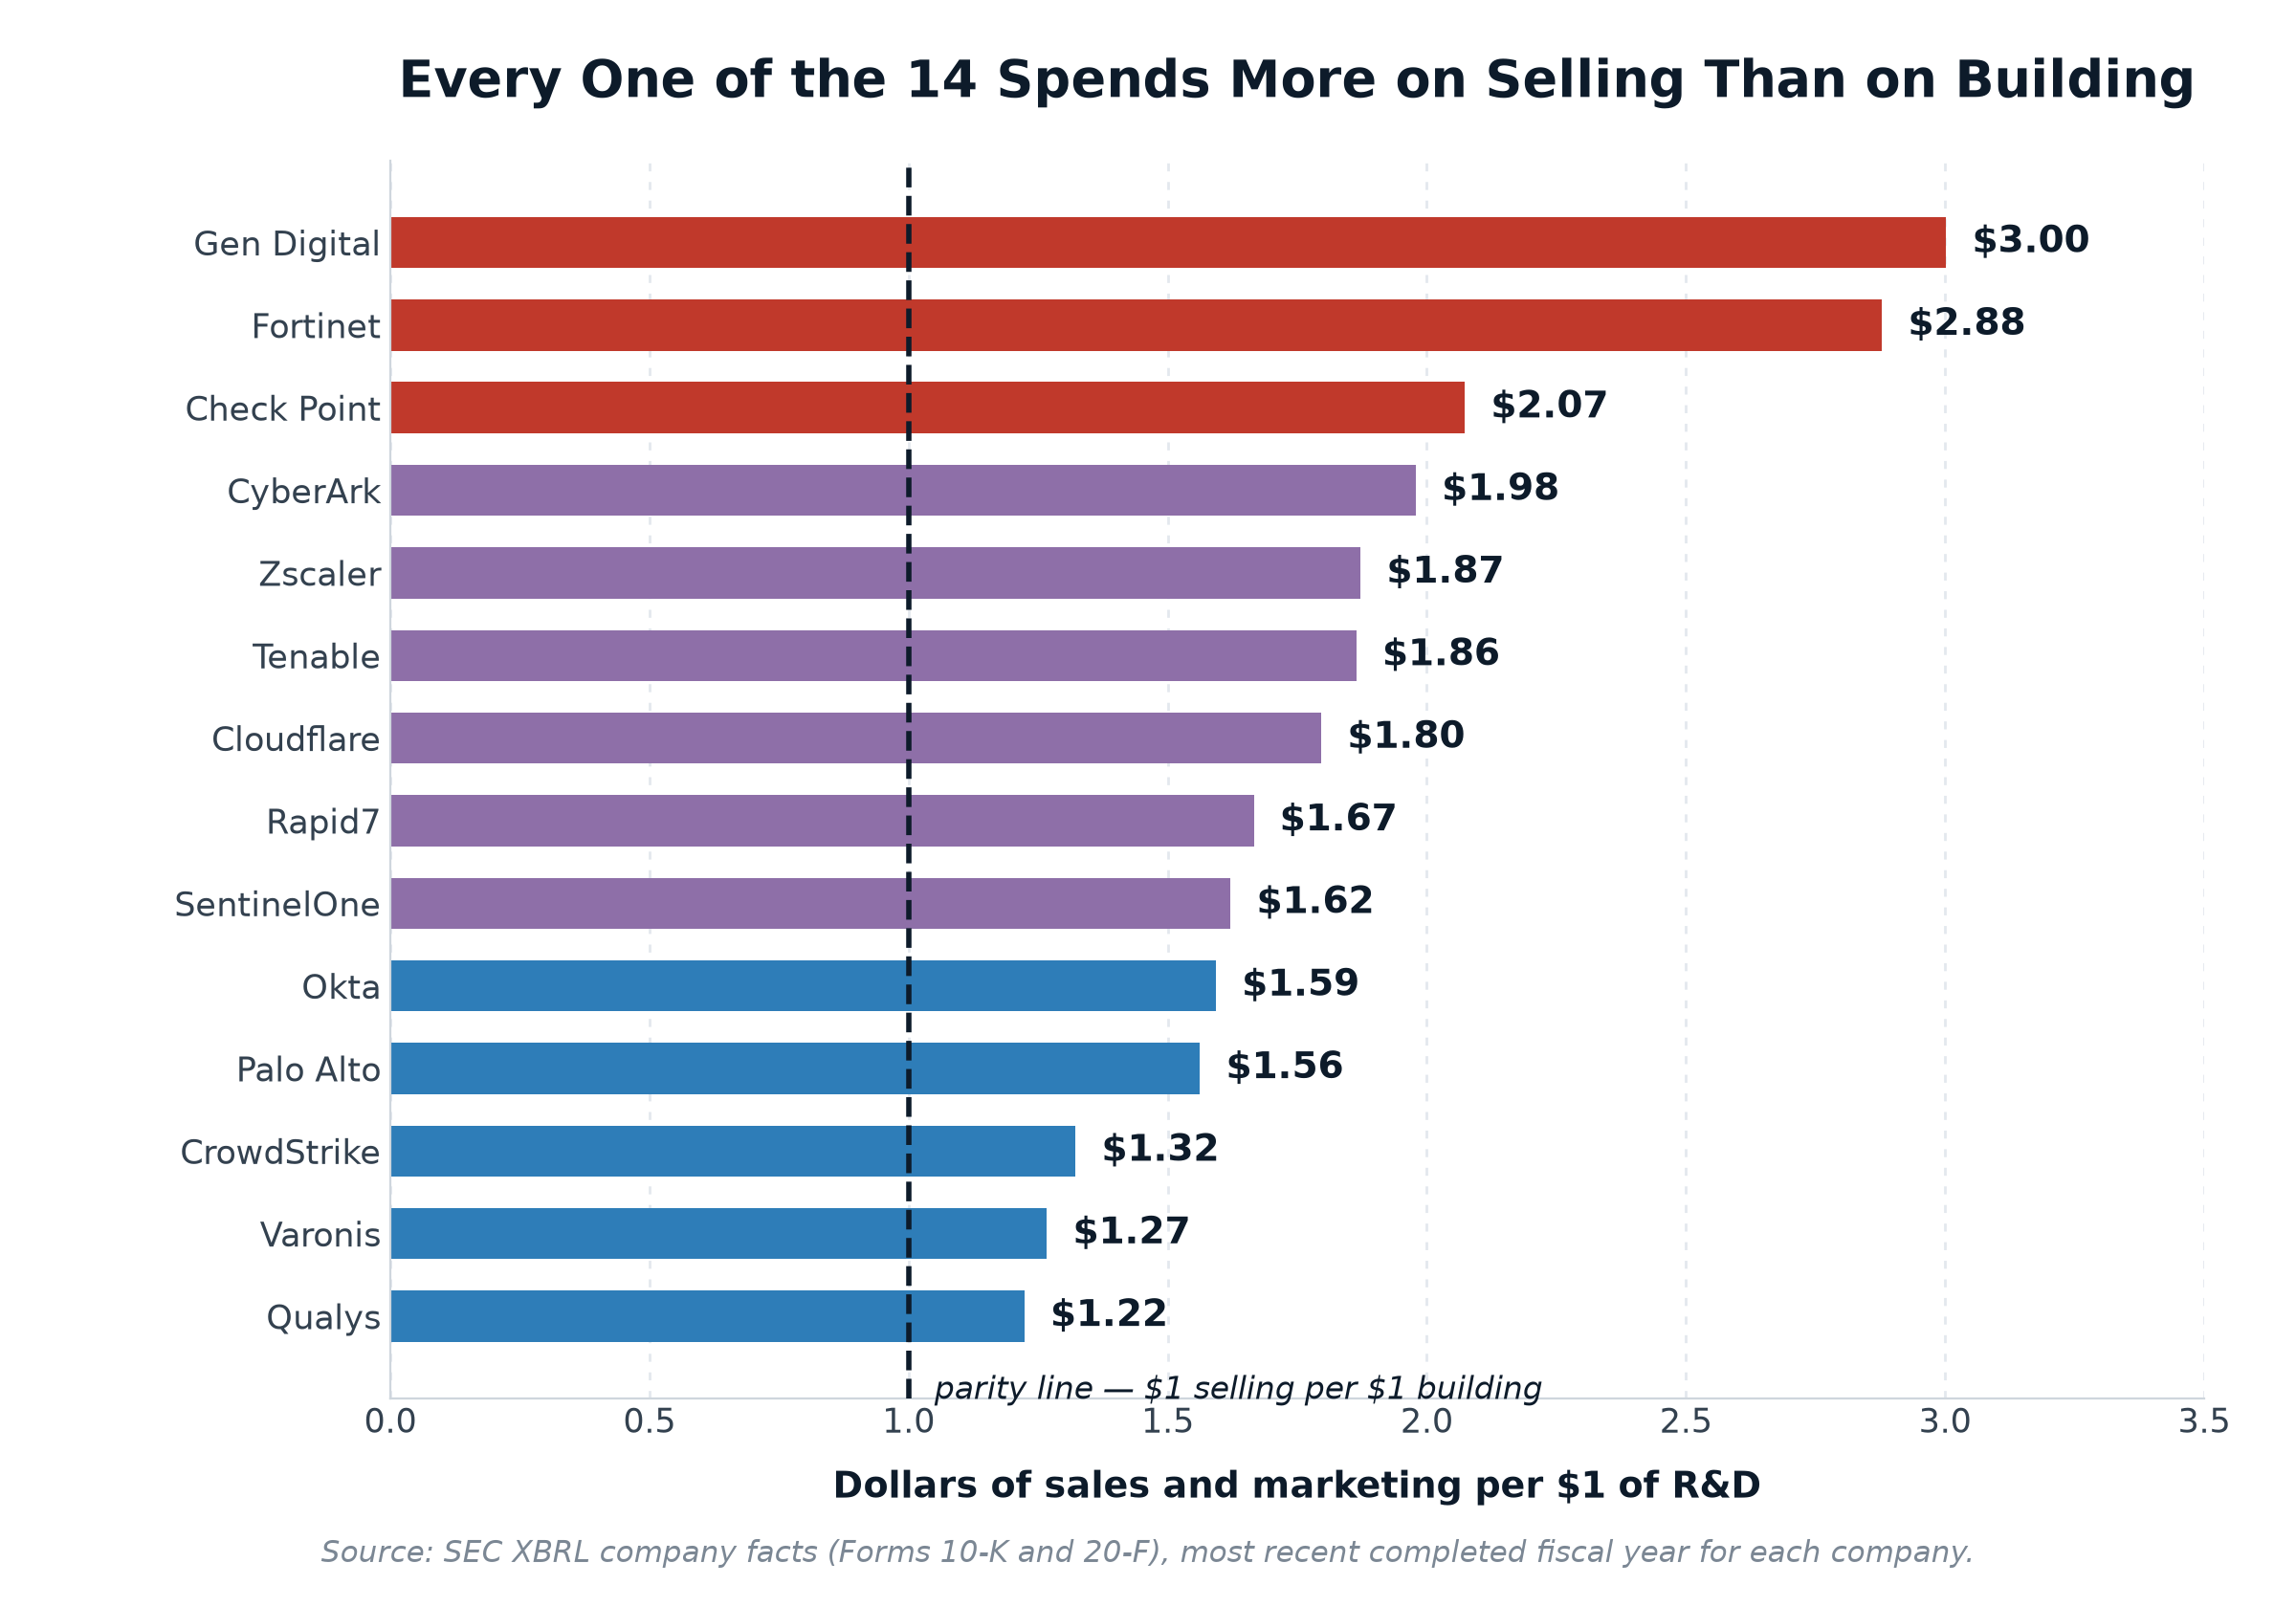
Key finding. The pattern has no exceptions. All fourteen companies spend more on selling than on building — from Qualys at $1.22 to Gen Digital at $3.00. It holds for hardware-led vendors and pure SaaS, for the most profitable firm in the sector and the least, for the oldest and the newest, and for the one company whose entire reputation rests on product-led growth. A distribution with zero counterexamples across that much variation is describing a structural property of the market, not a set of management choices.
Enterprise security is sold, not bought. That sentence is a cliché inside the industry and an accounting fact outside it — and the income statements say the gap between the two activities is wider, and more universal, than the cliché implies.
Method, and Why It Matters Here
Every figure below comes from the SEC’s XBRL company facts API, which serves the exact tagged values companies file in their annual reports. Sales and marketing is the SellingAndMarketingExpense tag; research and development is ResearchAndDevelopmentExpense. No estimates, no analyst models, no third-party reconstructions.
This matters because the obvious alternative framing — comparing headcount in sales versus engineering — cannot be done credibly. Companies disclose total headcount in their 10-Ks, and often its geographic distribution, but not its functional split. Fortinet’s fiscal 2025 filing, for instance, reports 15,109 employees and the share in each region, and stops there. The functional percentages that circulate publicly come from vendors that infer job families from scraped professional-network profiles, and those vendors disagree sharply: for the same company in the same period, one puts engineering at 42 percent and sales and marketing at 17 percent, while another puts sales and support near 38 percent and engineering near 30 percent. Both also assign 37 to 40 percent of staff to “finance and operations,” a bucket implausibly large on its face and almost certainly absorbing support, IT and other functions.
A note on what was excluded. Headcount ratios are omitted from this analysis entirely. They are not disclosed by the companies, the available third-party estimates differ by more than two-fold on identical firms, and the category definitions are not published. Dollars reported to the SEC under penalty of law are a different class of evidence, and the argument here rests only on those.
The Ranking
| Company | Fiscal year | S&M ($M) | R&D ($M) | Per $1 R&D |
|---|---|---|---|---|
| Gen Digital | FY2026 (Apr) | 1,228 | 409 | $3.00 |
| Fortinet | FY2025 | 2,348 | 816 | $2.88 |
| Check Point | FY2025 | 947 | 457 | $2.07 |
| CyberArk | FY2024 | 481 | 243 | $1.98 |
| Zscaler | FY2025 (Jul) | 1,259 | 672 | $1.87 |
| Tenable | FY2025 | 417 | 224 | $1.86 |
| Cloudflare | FY2025 | 921 | 512 | $1.80 |
| Rapid7 | FY2025 | 318 | 191 | $1.67 |
| SentinelOne | FY2026 (Jan) | 525 | 324 | $1.62 |
| Okta | FY2026 (Jan) | 1,018 | 639 | $1.59 |
| Palo Alto Networks | FY2025 (Jul) | 3,100 | 1,984 | $1.56 |
| CrowdStrike | FY2026 (Jan) | 1,831 | 1,385 | $1.32 |
| Varonis | FY2025 | 301 | 238 | $1.27 |
| Qualys | FY2025 | 144 | 117 | $1.22 |
| Aggregate | 14 companies | 14,838 | 8,210 | $1.81 |
The median is $1.73 and the mean $1.84. The distribution is tight in the middle — nine of the fourteen sit between $1.50 and $2.10 — with a thin tail at either end. What is remarkable is not the average but the absence of a single company on the other side of parity.
The Cases That Should Have Broken the Pattern
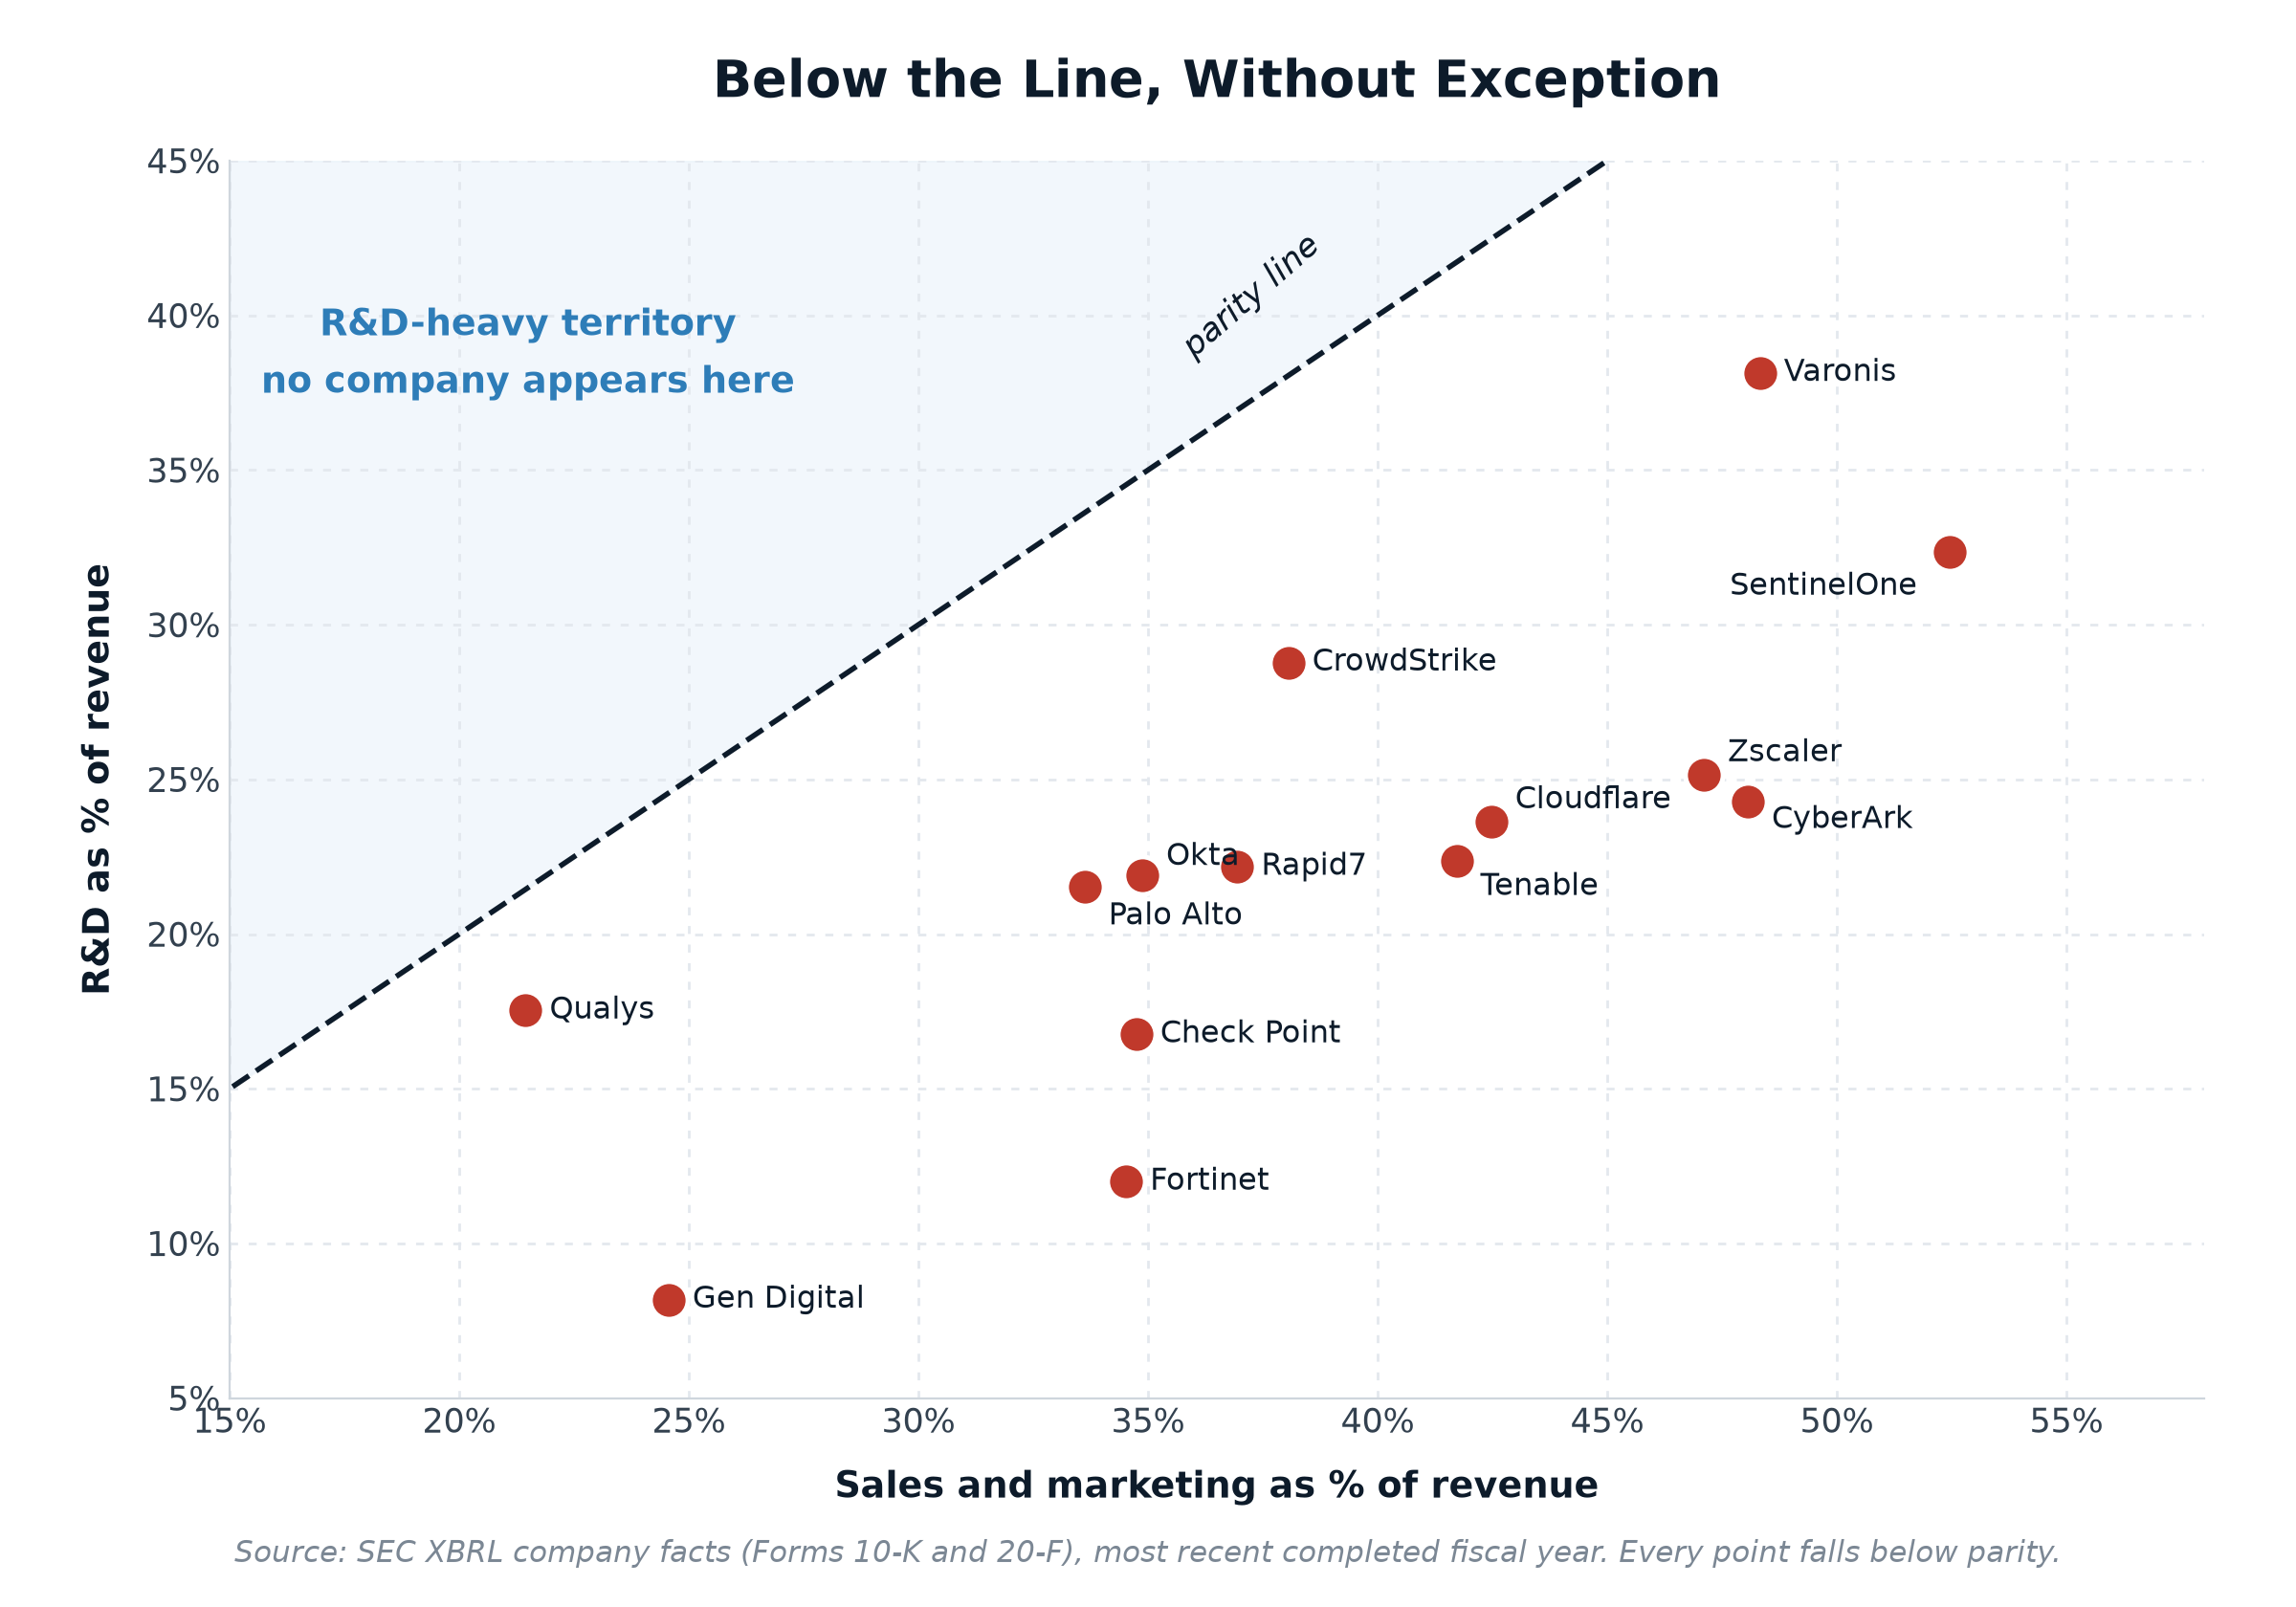
A pattern is only interesting if it survives the companies designed to defy it. Four here should have, and none does.
Cloudflare, at $1.80, is the most instructive. No company in this sample is more associated with product-led growth — a free tier, a developer-first reputation, adoption that supposedly precedes any conversation with a salesperson. If bottom-up adoption structurally reduced the cost of selling, it would show here. Instead Cloudflare spends more per R&D dollar than Palo Alto Networks, CrowdStrike, Okta, and SentinelOne. Product-led growth changes how the first user arrives; it does not appear to change what it costs to convert an enterprise contract.
Check Point, at $2.07, is the second. Check Point is the sector’s byword for financial discipline — consistently profitable, famously unwilling to buy growth, operating income of $831.1 million on $2.73 billion of revenue in fiscal 2025. That profile might predict restraint on distribution. It spends more than two dollars selling for every dollar building, placing it third-highest in the sample and well above every venture-era growth company on the list except Fortinet.
Fortinet, at $2.88, shows the hardware-and-channel model at its most extreme. Fortinet reports the highest gross margins and one of the highest operating margins in the group, and still runs the second-widest gap. Its sales and marketing line is dominated by personnel and by channel programs — partner cooperative marketing, field marketing, events. A channel model does not outsource the cost of distribution so much as relocate it inside the sales and marketing line.
Qualys, at $1.22, is the closest thing to a counterexample — and it proves the rule in a specific way. Qualys spends just 21.4 percent of revenue on sales and marketing, the lowest ratio in the sample by a wide margin, and it is durably profitable. But its revenue is $669 million and growing slowly. The company that spends least on distribution is also the one that has grown least. That is the trade the sector has collectively refused to make.
Why the Market Produces This Shape
A pattern this consistent across business models is unlikely to be a coincidence of management preference. Four structural features of enterprise security purchasing explain most of it.
The product’s core claim cannot be evaluated before purchase. A buyer can trial a database and measure query latency. A buyer cannot test whether a security platform will stop the breach that has not happened yet. Efficacy claims rest on detection rates against known threats, third-party test results, analyst placement, and reference customers — all of which are, in the economic sense, marketing artifacts rather than product experiences. When the good is a credence good, expenditure shifts from demonstrating quality to establishing credibility.
The purchase is made by a committee under compliance pressure. Enterprise security procurement typically involves the security team, IT, procurement, legal, and increasingly the board’s risk committee, against a backdrop of regulatory requirements and cyber-insurance conditions. Each additional stakeholder lengthens the cycle and multiplies the touchpoints a vendor must staff. Sales expense scales with the number of people who must be persuaded, not with the sophistication of the code.
Displacement, not greenfield, is the growth motion. Nearly every deal in this sector removes an incumbent. Switching costs in security are unusually high — integrations, tuned policies, trained staff, audit continuity — so winning requires overcoming inertia rather than meeting an unmet need. Overcoming inertia is a sales activity.
The line item is broader than “advertising.” Under US GAAP, sales and marketing captures quota-carrying reps and their commissions, sales engineers, customer success and renewals staff, channel and partner programs, events, and amortized contract-acquisition costs. A meaningful share of what appears here is retention and expansion work on existing customers, which is closer to service delivery than to demand generation. This does not dissolve the finding, but it does mean the ratio should not be read as pure persuasion spend.
What the Ratio Does Not Prove
The temptation is to read these numbers as evidence that the industry is under-engineering its products. The data does not support that inference, and the honest version of the argument has to say why.
R&D understates total engineering effort. For cloud-delivered security, a substantial amount of technical work sits in cost of revenue rather than R&D — the engineers running detection infrastructure, the security operations analysts staffing managed services, threat intelligence teams. A pure-SaaS vendor and an appliance vendor allocate these differently, so cross-company comparison of the R&D line alone is imperfect.
Sales capacity is an investment with a return. In a market growing at double digits with high switching costs, the first vendor into an account often holds it for years. Front-loading distribution to capture accounts before a competitor does is a defensible allocation of capital, not evidence of waste. The relevant test is payback period and lifetime value, which this ratio does not measure.
Two companies in the sample are not directly comparable. Gen Digital, the highest ratio at $3.00, is principally a consumer business (Norton, Avast, LifeLock) where marketing spend behaves like retail customer acquisition rather than enterprise selling. Cloudflare is a broader internet-infrastructure company of which security is one part. Both are included for range; neither should carry the argument. Excluding them, the remaining twelve still average above $1.70 and every one remains above parity.
Fiscal years are not aligned. The companies here close their books between January and July, so the sample spans roughly eighteen months of economic conditions rather than a single synchronized period. CyberArk’s figures are fiscal 2024 rather than 2025, as its most recent annual filing was not yet tagged at the time of writing. This introduces noise into the aggregate but cannot explain a fourteen-of-fourteen result.
The One Signal Pointing the Other Way
There is a countervailing trend worth recording, and it appears at the company with the largest R&D budget among the pure-play vendors.
In fiscal 2026, CrowdStrike’s research and development expense rose 29 percent year over year, to $1.385 billion, while sales and marketing rose 20 percent, to $1.831 billion. R&D grew faster than distribution — and at that differential, the company’s ratio compresses each year it continues. CrowdStrike already sits second-lowest in the sample at $1.32.
One year at one company is not a trend, and the direction may reflect a specific investment cycle rather than a structural change. But it is the only movement in the data that runs against the pattern, and if the economics of this sector are going to shift, this is the shape the first evidence would take.
What to Watch
Whether AI-assisted engineering compresses the denominator or the numerator. If code generation makes R&D more productive, R&D spend could fall while output rises, widening the ratio while improving the product. The ratio would look worse and the industry would be healthier. It is a reminder that this metric measures allocation, not effectiveness.
Platform consolidation. Vendors argue that selling one platform instead of six point products should reduce distribution cost per dollar of revenue. Palo Alto Networks has pursued this most aggressively and sits at $1.56, below the median but not dramatically. Whether consolidation actually lowers the ratio over several years is a testable claim.
The Qualys trade. If a low-distribution, high-margin, slow-growth model starts outperforming on total shareholder return, capital allocation across the sector would follow. Watch whether any mid-cap deliberately moves toward that profile.
Conclusion. Fourteen companies, $41.5 billion of revenue, four distinct business models, fiscal years spanning a year and a half — and not one spends more building its product than selling it. The aggregate is $14.84 billion on distribution against $8.21 billion on engineering, a gap of $6.63 billion. The correct reading is not that these firms are badly run; several are among the best-run software businesses in the market. It is that enterprise security is a category where the buyer cannot verify the central claim before purchasing, and where the cost of establishing trust therefore exceeds the cost of engineering the thing being trusted. That is a property of the market, and no individual company in this sample has found a way out of it.
Sources
All expense and revenue figures: U.S. Securities and Exchange Commission, XBRL company facts API (SellingAndMarketingExpense, ResearchAndDevelopmentExpense, revenue tags), Forms 10-K and 20-F, most recent completed fiscal year for each company. https://www.sec.gov/search-filings/edgar-application-programming-interfaces
Fortinet, Inc. Form 10-K, fiscal year ended December 31, 2025. https://www.sec.gov/Archives/edgar/data/1262039/000126203926000007/ftnt-20251231.htm
Palo Alto Networks, Inc. Form 10-K, fiscal year ended July 31, 2025, and fourth-quarter results release. https://www.sec.gov/Archives/edgar/data/1327567/000132756725000027/panw-20250731.htm
CrowdStrike Holdings, Inc. Form 10-K, fiscal year ended January 31, 2026. https://www.sec.gov/Archives/edgar/data/1535527/000153552726000010/crwd-20260131.htm
Zscaler, Inc. Form 10-K, fiscal year ended July 31, 2025. SEC EDGAR filing index
Check Point Software Technologies Ltd. Fourth quarter and full year 2025 results (consolidated statement of income), and Form 20-F. https://www.checkpoint.com/press-releases/check-point-software-reports-fourth-quarter-and-2025-full-year-results/
SentinelOne, Inc. Form 10-K, fiscal year ended January 31, 2026. https://www.sec.gov/Archives/edgar/data/1583708/000158370826000020/s-20260131.htm
Additional company facts for Okta, Qualys, CyberArk, Cloudflare, Tenable, Rapid7, Varonis and Gen Digital retrieved from the same SEC XBRL endpoint, most recent annual filing in each case.