

Executive Summary
On July 17, 2026, the Federal Reserve Bank of San Francisco released Working Paper 2026-14, titled “Do Vibes Predict Recessions? Evidence from a Big-Data Forecasting Framework.” The paper compares two recession-forecasting models trained on real-time data from August 1999 through May 2026. One uses only conventional hard indicators from FRED-MD. The other uses only soft data on beliefs, sentiment, and narratives. The paper’s central finding is that a small set of soft indicators forecasts recessions at least as well as a much larger panel of hard indicators, and often better at short horizons (Petrosky-Nadeau, Sung, and Wilson, 2026).
The precision-recall area under the curve, a threshold-free measure of forecast quality, was 0.76 for the soft-data model at the one-month horizon compared with 0.61 for the hard-data model. Combining both raised the number to 0.77. Similar advantages held at three and six months. Only at the twelve-month horizon did the hard-data and combined models begin to catch up. The soft-data model achieved a 79 percent recall on pre-recession months at the one-month horizon, compared with 43 percent for the hard-data model, though at the cost of a lower precision, 36 percent versus 60 percent.
Key finding. The paper reframes the “vibecession” debate. When soft indicators diverge from hard data, they are not necessarily noise. They are an independent recession signal that has, on average, been informative. The current moment provides a live test: the University of Michigan Consumer Sentiment Index rose from a May 2026 all-time series low of 44.8 to a July 2026 preliminary reading of 54.4, a five-month high, but still roughly 12 percent below the year-ago level.
A new Federal Reserve Bank of San Francisco paper puts numbers on a debate that has divided economists since 2022. When sentiment surveys diverge from hard economic data, which one should forecasters believe? The answer, according to the paper, is that both matter, and soft data may matter more than the profession has assumed.
The term vibecession entered the American economic vocabulary in June 2022, when content creator and economics writer Kyla Scanlon coined it in a Substack article titled “The Vibecession: The Self-Fulfilling Prophecy.” Scanlon used the term to describe a period when consumer sentiment collapsed to historically low levels even as gross domestic product and employment held up (Scanlon, 2022). The term spread through mainstream financial media in 2023 and 2024 and appeared in Federal Reserve speeches, cable television, and academic commentary (The Wall Street Journal, 2024).
For forecasters, the underlying question was harder than the term suggested. When soft data such as consumer surveys, news sentiment, and uncertainty indexes deteriorate sharply while hard data remain resilient, should the soft data be treated as noise, or as an early warning? On July 17, 2026, three economists at the Federal Reserve Bank of San Francisco published Working Paper 2026-14, an empirical answer.
Nicolas Petrosky-Nadeau, vice president of economic research at the San Francisco Fed; Yeji Sung, economist in the same department; and Daniel J. Wilson, also vice president of economic research, built a real-time out-of-sample forecasting framework covering August 1999 through May 2026. Their goal was to isolate the marginal information content of soft data after controlling for a much larger set of conventional macroeconomic and financial indicators. The result is one of the most rigorous statistical tests of the vibecession thesis published to date.
The Framework
The paper trains two elastic-net regularized logit models to estimate the probability that a recession, as dated by the National Bureau of Economic Research, will occur within one, three, six, or twelve months of the forecast date. The forecasting sample covers three NBER recessions: March to November 2001, December 2007 to June 2009, and February to April 2020 (National Bureau of Economic Research, 2020).
The hard-data panel draws from FRED-MD real-time vintages and is organized into five categories: real activity, housing, the yield curve, other financial indicators, and inflation. The soft-data panel is deliberately narrow. It contains six University of Michigan consumer survey variables, the Baker, Bloom, and Davis Economic Policy Uncertainty index, the San Francisco Fed’s own Daily News Sentiment Index built from newspaper text (Shapiro, Sudhof, and Wilson, 2022), and a Beige Book sentiment index that converts qualitative Federal Reserve district reports into a quantitative indicator (Filippou et al., 2024).
The authors evaluate model performance using four metrics: F1 score at two probability thresholds, the precision-recall area under the curve (PR-AUC), and the receiver operating characteristic area under the curve (AUC). PR-AUC is the primary threshold-free metric because it does not reward models that avoid false alarms simply by never issuing warnings, which is a live concern for rare events like recessions.
The Result
The soft-data model outperformed the hard-data model at every horizon on the PR-AUC metric, despite using a much smaller predictor set.
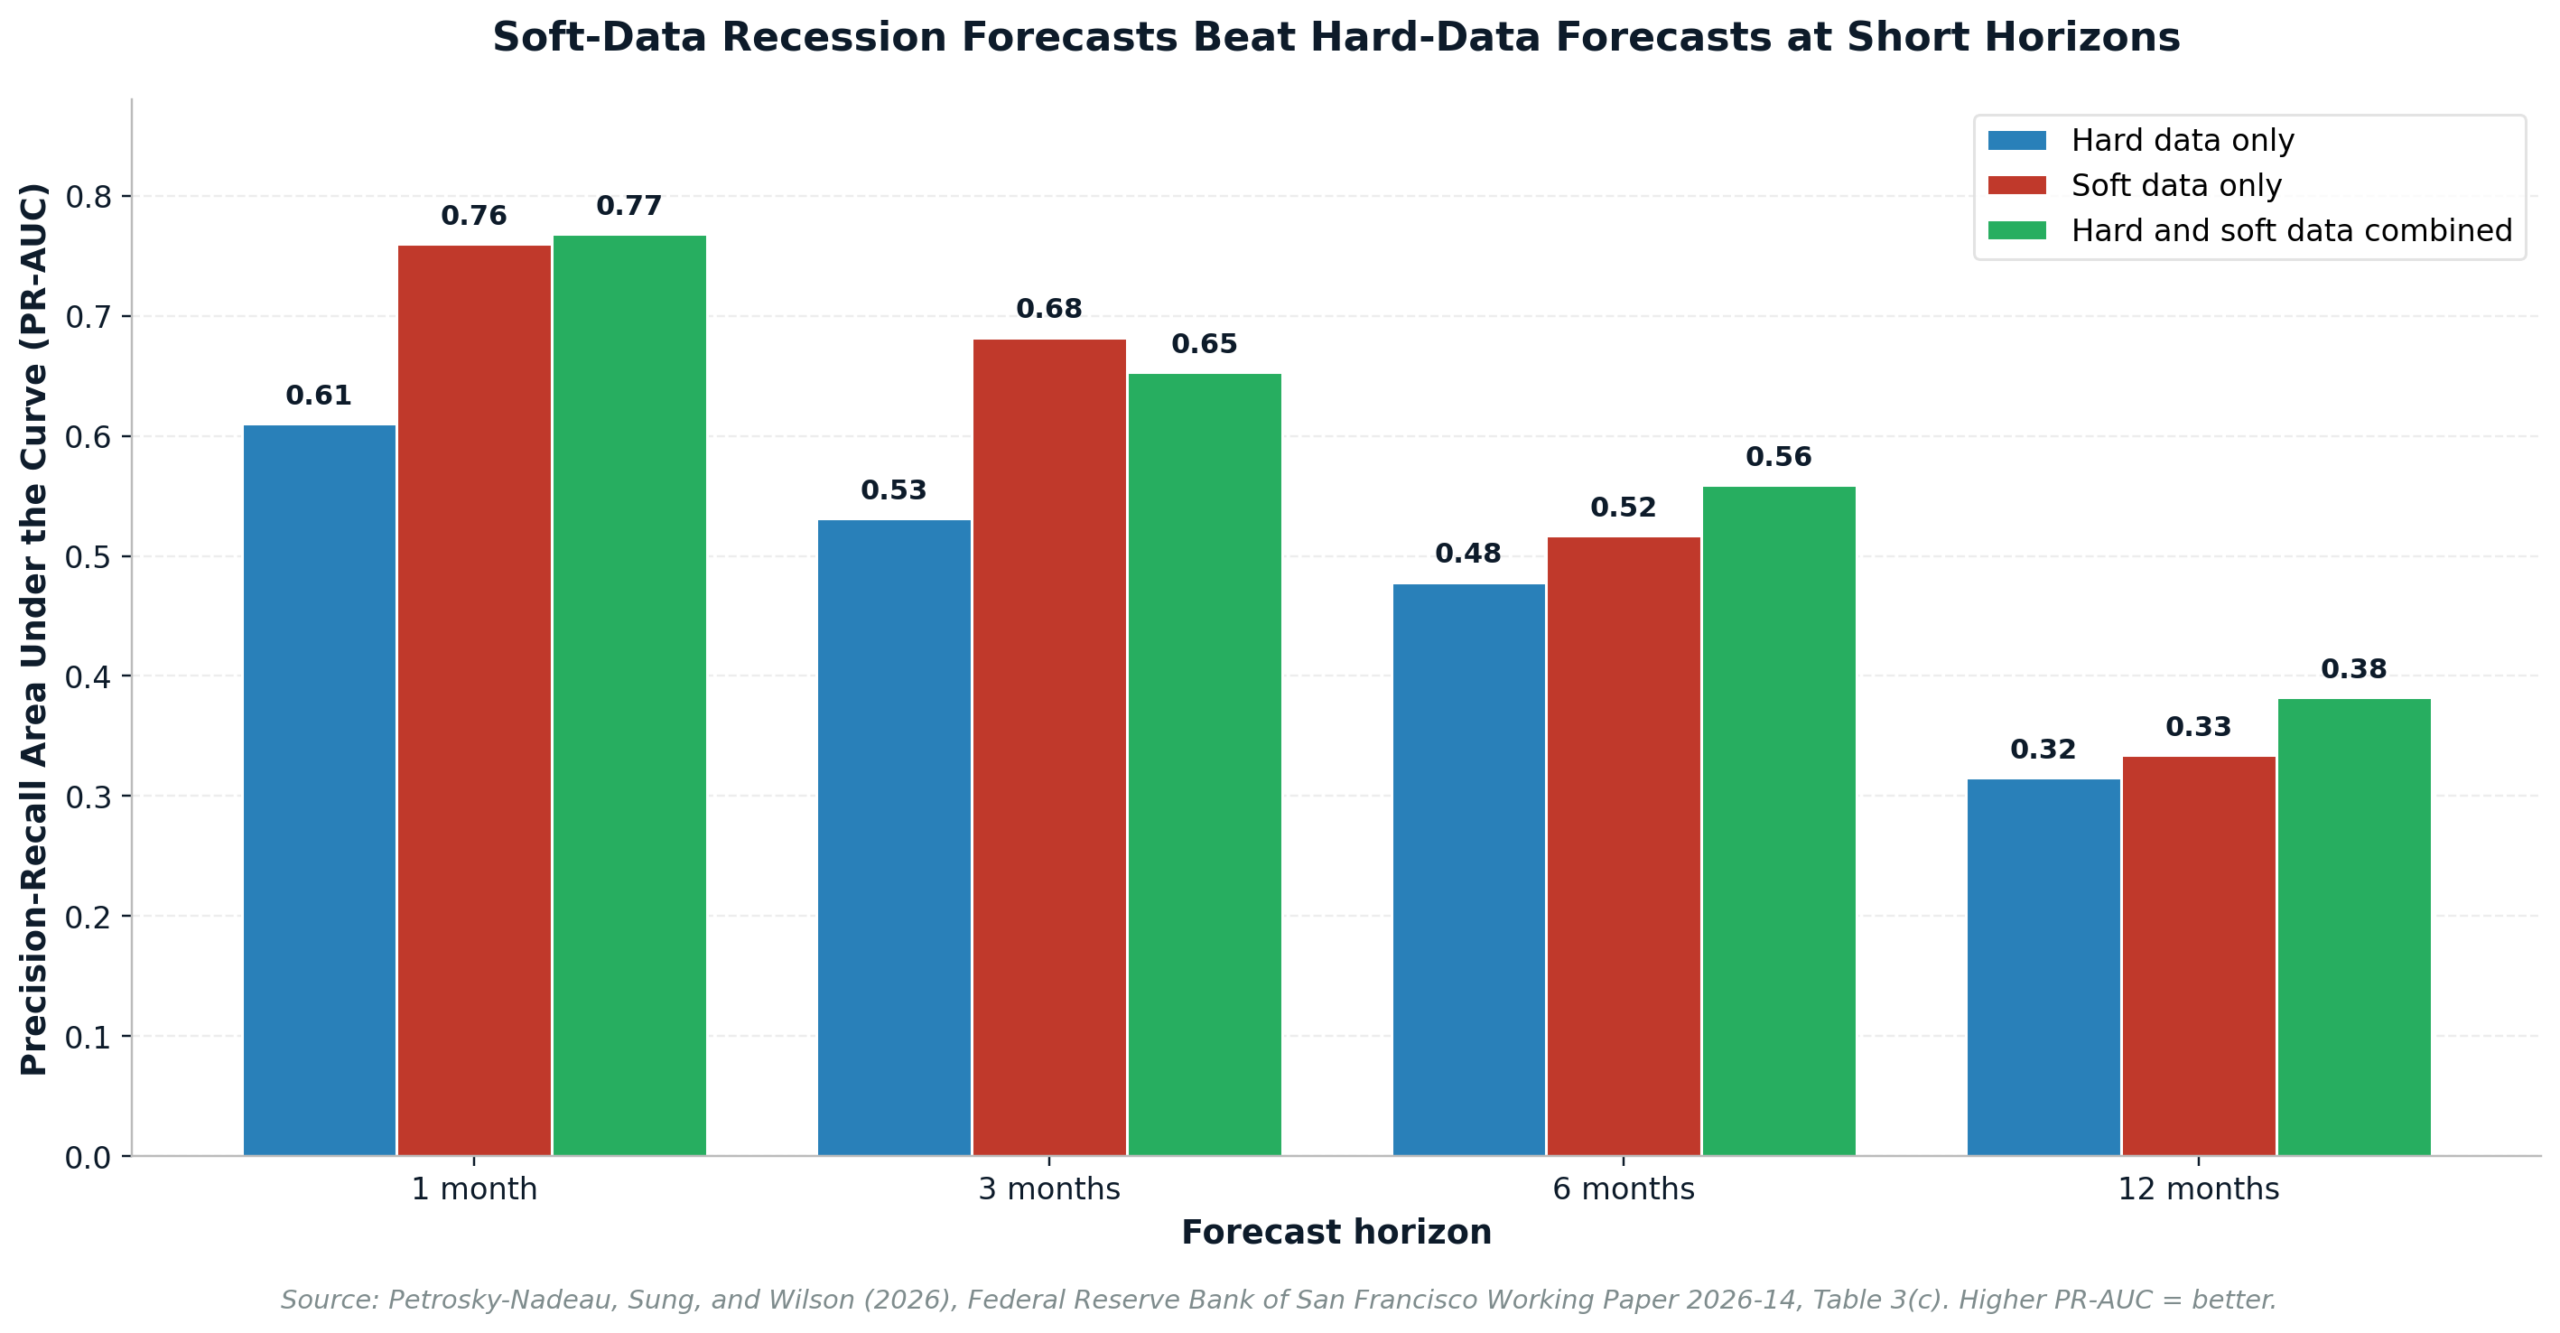
Combining both improved performance further at the one-, six-, and twelve-month horizons. Only at three months did the combined model score slightly below the soft-data-only model (Petrosky-Nadeau et al., 2026, Table 3).
To understand what the two models are actually doing differently, the paper looks at precision and recall separately at the one-month horizon, using a 25 percent probability cutoff to convert probabilities into warnings. Precision measures the share of warnings followed by a recession. Recall measures the share of pre-recession months the model correctly flagged.
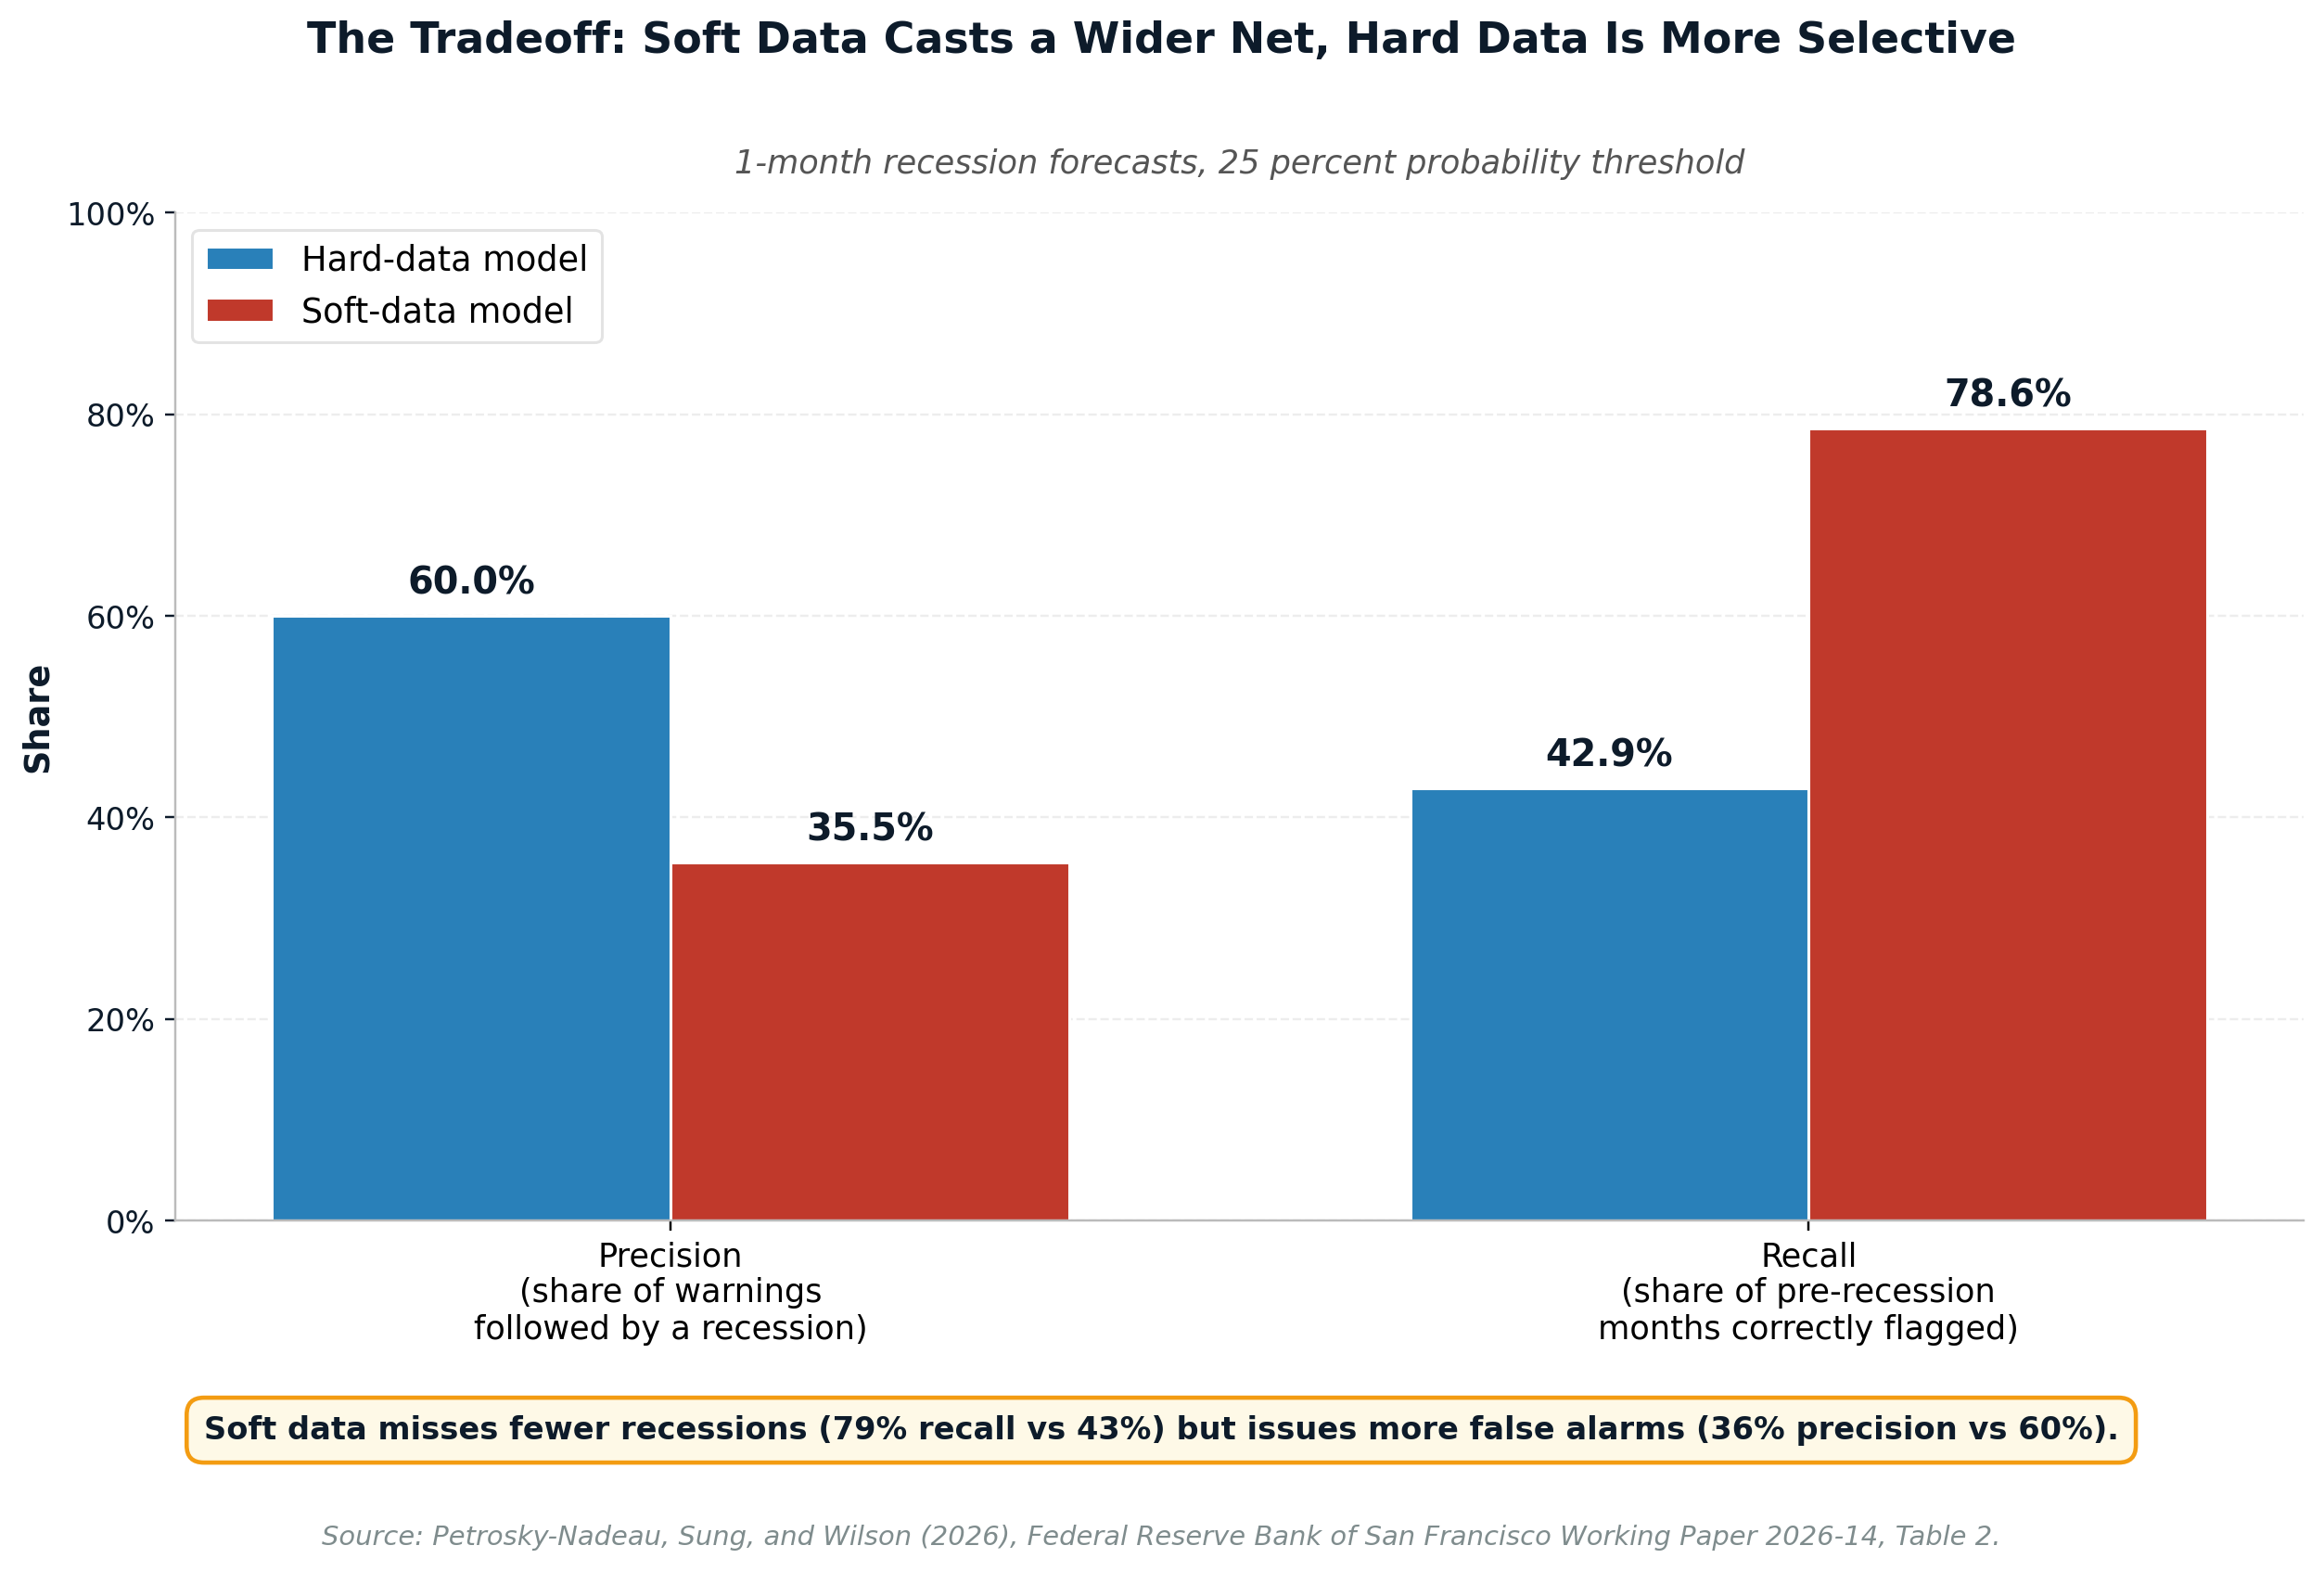
The pattern is stark. The soft-data model caught 79 percent of the months that were followed by a recession within one month. The hard-data model caught only 43 percent. But when the soft-data model issued a warning, only 36 percent of those warnings turned out to be justified within the horizon; the hard-data model got 60 percent of its warnings right. In the authors’ own language, “soft data cast a wider net, while hard-data recession signals are more selective” (Petrosky-Nadeau et al., 2026, p. 2).
The methodological context. The paper’s real-time design controls for two problems that flatter conventional recession research. First, hard macroeconomic data are typically released with lags and later revised, so a model trained on today’s revised data has information the real-time forecaster did not. Second, recessions are rare events, and models trained on the full sample can overfit patterns from past downturns. The authors re-run their entire estimation, including hyperparameter selection, at every forecast date using only the data vintage that would have been available then. That design is the reason the paper’s results can be trusted as guidance for the current moment.
Why Soft Data Help
The paper poses and tests two candidate explanations. The first is that soft data proxy for hard data that have not yet been released or are still noisy. The second is that soft data contain independent recession signals that hard data do not capture even after revisions.
To separate the two, the authors compare hard-data models built from three different data vintages: the real-time vintage available at the forecast date, a next-month vintage that adds observations released one month later, and the latest vintage that includes all subsequent revisions. Hard-data forecasts improved as more informative vintages became available, confirming that publication lags and initial-release noise hamper real-time forecasting. Yet soft data continued to add forecasting power even against the latest revised hard-data vintage. The paper concludes that “soft data both proxy for information that later appears in hard-data releases and contain distinct information about recession risk” (Petrosky-Nadeau et al., 2026, p. 3).
Within the soft-data block, the Michigan consumer survey variables did most of the work. When the authors dropped the Michigan variables and kept the text-based indicators alone, PR-AUC at one month fell from 0.77 to 0.60, below the hard-data baseline. When they dropped one text-based indicator at a time but kept Michigan, performance held. The authors conclude that “the incremental contribution of soft data does not depend entirely on the text-based indicators” (Petrosky-Nadeau et al., 2026, Section 8.1).
The Current Signal
The paper’s sample ends in May 2026, which coincidentally captured the recent low in consumer sentiment. Since then, the University of Michigan Consumer Sentiment Index has rebounded. The preliminary July 2026 reading, released on July 17, was 54.4, up from a final reading of 49.5 in June and above the consensus of 51.0 (University of Michigan, 2026a).
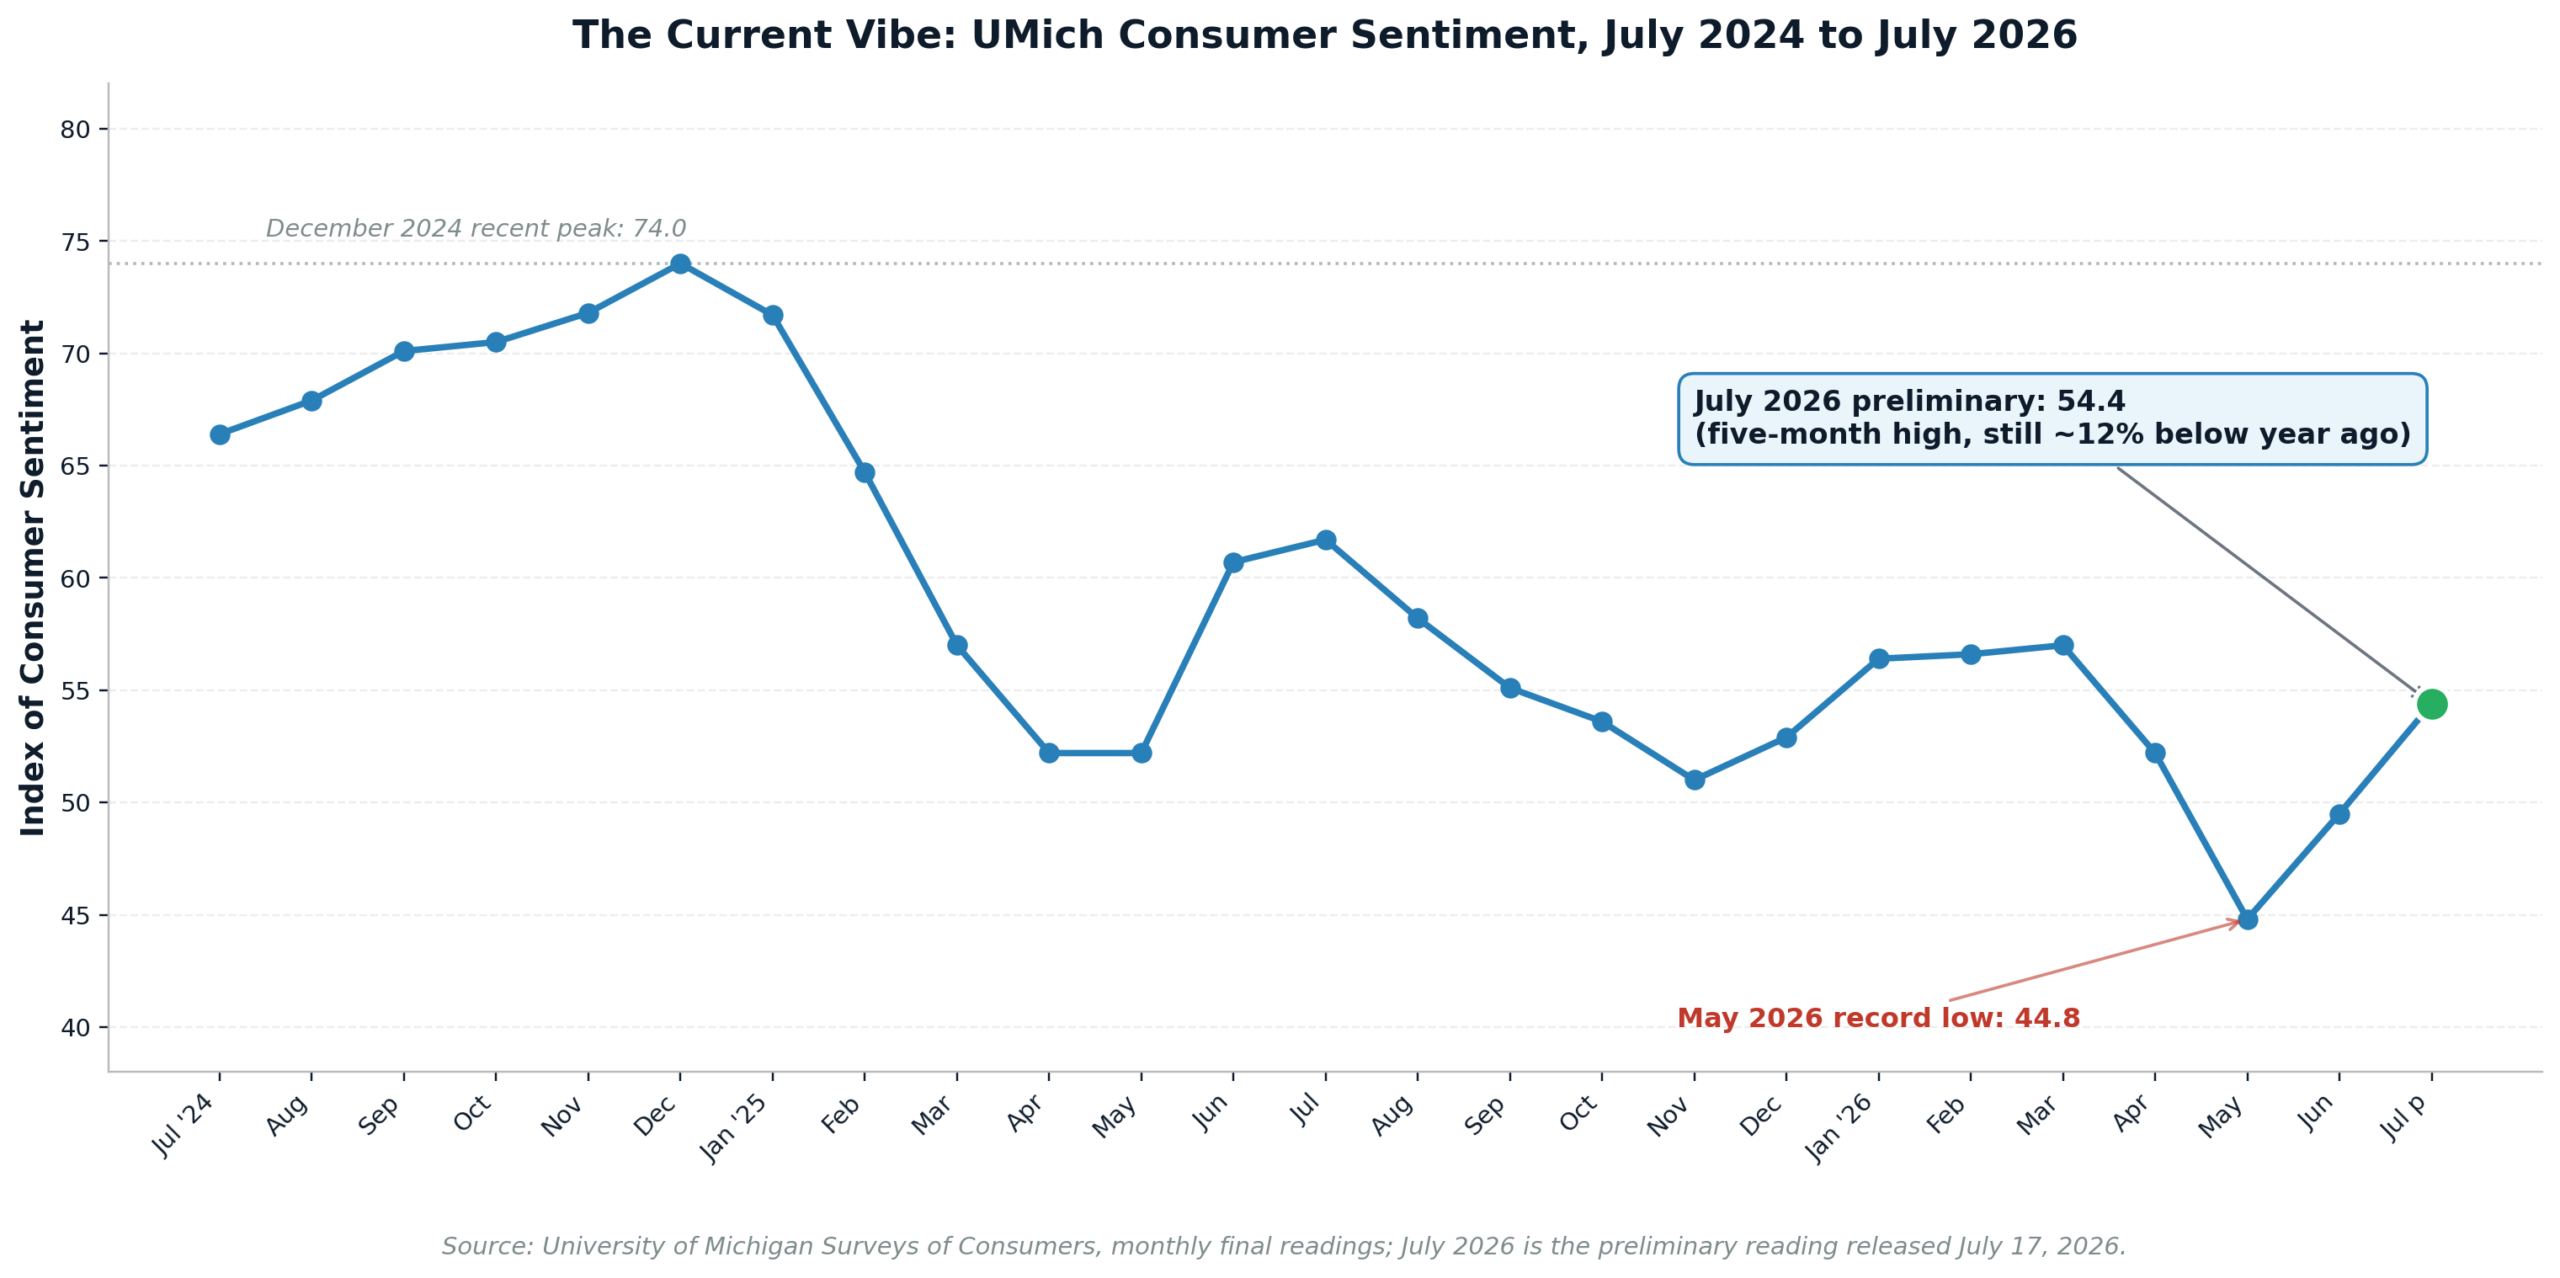
Joanne Hsu, director of the Surveys of Consumers, attributed the rise to easing gasoline prices and rising expectations. All five subcomponents of the index improved. Year-ahead inflation expectations eased from 4.6 percent in June to 4.2 percent in July. The five-year inflation expectation held at 3.3 percent. Sentiment remained roughly 12 percent below its year-ago reading of 61.7, but the trajectory has reversed off the May 2026 series low of 44.8 (University of Michigan, 2026a; University of Michigan, 2026b).
Under the framework of the San Francisco Fed paper, this is exactly the situation the combined model was built for. A rising soft-data signal, in a context where hard data have also been mixed, calls for looking at whether hard-data categories corroborate or offset the sentiment move. The paper’s Shapley decompositions show that when hard-data categories move in the same direction as soft data, elevated recession risk is preserved. When hard data provide little support, the combined model mutes the soft-data signal. As of mid-July 2026, the combined signal is not obviously flashing red.
What the Data Does Not Say
The paper has three limits its authors flag explicitly. First, the sample contains only three recessions: 2001, 2007 to 2009, and 2020. Statistical power for rare events is limited by definition, and the 2020 recession was highly atypical. Second, the soft-data set used in the paper is a narrow subset of the available information on beliefs and narratives. Broader measurement of surveys and text could change the results. Third, the paper does not identify the specific channels through which soft data carry recession-relevant information. Whether sentiment causes spending contractions, or merely anticipates them, remains open (Petrosky-Nadeau et al., 2026, p. 34).
The paper also does not resolve the vibecession debate. Its finding is that soft-data signals contain recession-relevant information on average across the sample. It does not follow that any given period of soft-data weakness is a real early warning. Some soft-data declines are correctly informative, others are false alarms. The paper’s own precision estimate at the one-month horizon says 36 percent of soft-data warnings turn out to be justified, meaning 64 percent do not. The value of the framework is that combining hard and soft data helps distinguish the two categories after the fact.
What to Watch
Four series will indicate whether the July 2026 sentiment bounce is the start of a sustained recovery or a temporary reprieve.
- UMich Consumer Sentiment final release for July 2026. The final reading, due late July, will confirm or revise the 54.4 preliminary. A durable move above 60 would mark a meaningful improvement.
- SF Fed Daily News Sentiment Index. Published on the SF Fed website and updated daily, the index captures tone in newspaper economic coverage. It is one of the specific soft-data measures the paper uses.
- Baker, Bloom, and Davis Economic Policy Uncertainty index. Also updated daily, this index measures policy-related uncertainty in newspaper text and has been highly informative during periods of trade and tariff friction.
- Federal Reserve Beige Book. The next release will contribute a district-level qualitative assessment. The Beige Book sentiment index used in the paper draws directly from these reports.
Bottom line. The San Francisco Fed paper does not vindicate every gloomy sentiment reading of the past four years as a missed recession warning. It does something more useful. It puts a defensible number on the marginal recession-forecasting content of soft data at short horizons, and shows that content survives careful controls for publication lags, revisions, and overfitting. For forecasters, the practical implication is that soft indicators should be tracked alongside hard data rather than dismissed as noise. For the profession, the paper closes a debate that had been running on assertion since 2022, and reopens it as a quantitative research program.
References
Baker, S. R., Bloom, N., & Davis, S. J. (2016). Measuring economic policy uncertainty. The Quarterly Journal of Economics, 131(4), 1593-1636. https://doi.org/10.1093/qje/qjw024
Filippou, I., Garciga, C., Mitchell, J., & Nguyen, M. T. (2024, April). Regional economic sentiment: Constructing quantitative estimates from the Beige Book and testing their ability to forecast recessions. Economic Commentary, 2024(08), 1-8. Federal Reserve Bank of Cleveland.
National Bureau of Economic Research. (2020). Business cycle dating committee announcements. https://www.nber.org/research/business-cycle-dating/business-cycle-dating-committee-announcements
Petrosky-Nadeau, N., Sung, Y., & Wilson, D. J. (2026, July). Do vibes predict recessions? Evidence from a big-data forecasting framework (Federal Reserve Bank of San Francisco Working Paper No. 2026-14). https://doi.org/10.24148/wp2026-14
Scanlon, K. (2022, June 30). The vibecession: The self-fulfilling prophecy. Kyla’s Newsletter. https://kyla.substack.com/p/the-vibecession-the-self-fulfilling
Shapiro, A. H., Sudhof, M., & Wilson, D. J. (2022). Measuring news sentiment. Journal of Econometrics, 228(2), 221-243. https://www.frbsf.org/research-and-insights/data-and-indicators/daily-news-sentiment-index/
The Wall Street Journal. (2024, September 27). The 27-year-old economic adviser for Gen Z. https://www.wsj.com/
University of Michigan. (2026a, July 17). Preliminary results for July 2026: Surveys of Consumers. Surveys of Consumers. http://www.sca.isr.umich.edu/
University of Michigan. (2026b). Surveys of Consumers: Historical data table. https://data.sca.isr.umich.edu/