
Executive Summary
U.S. grocery unit sales fell 1.8 percent in June 2026 compared with a year earlier, a sharp reversal from the 0.1 percent year-over-year growth recorded in June 2025. That is according to a Bain & Company analysis of NielsenIQ grocery data shared with CNBC on July 16, 2026 (CNBC, 2026). Prices continue to rise between 2 and 3 percent year-over-year, but that inflation cushion is no longer enough to keep total grocery sales expanding.
Federal data confirm the pressure. The Bureau of Labor Statistics reported June 2026 food-at-home inflation at 2.7 percent year-over-year, with fruits and vegetables up 5.3 percent (U.S. Bureau of Labor Statistics, 2026). Cumulative food-at-home prices are now roughly 33 percent above January 2019, close to the roughly 32 percent rise in the overall Consumer Price Index over the same period. A gallon of regular gasoline hit a four-year high of $4.56 on Memorial Day weekend, adding fuel costs on top of grocery costs (American Automobile Association, 2026).
Key finding. The grocery slowdown is not a demand shock from any single event. It is the accumulated arithmetic of a seven-year price surge running ahead of wage gains, compounded by tighter federal food assistance and by a spring 2026 fuel spike. Packaged-food manufacturers are absorbing the impact through weaker volumes and heavier promotional spending. Private-label goods and value retailers are the market’s response.
A seven-year run of grocery inflation has caught up with the American consumer. Federal price data, Bain and Nielsen sales figures, and PepsiCo’s own earnings all point to the same conclusion: shoppers have run out of room to absorb higher food prices.
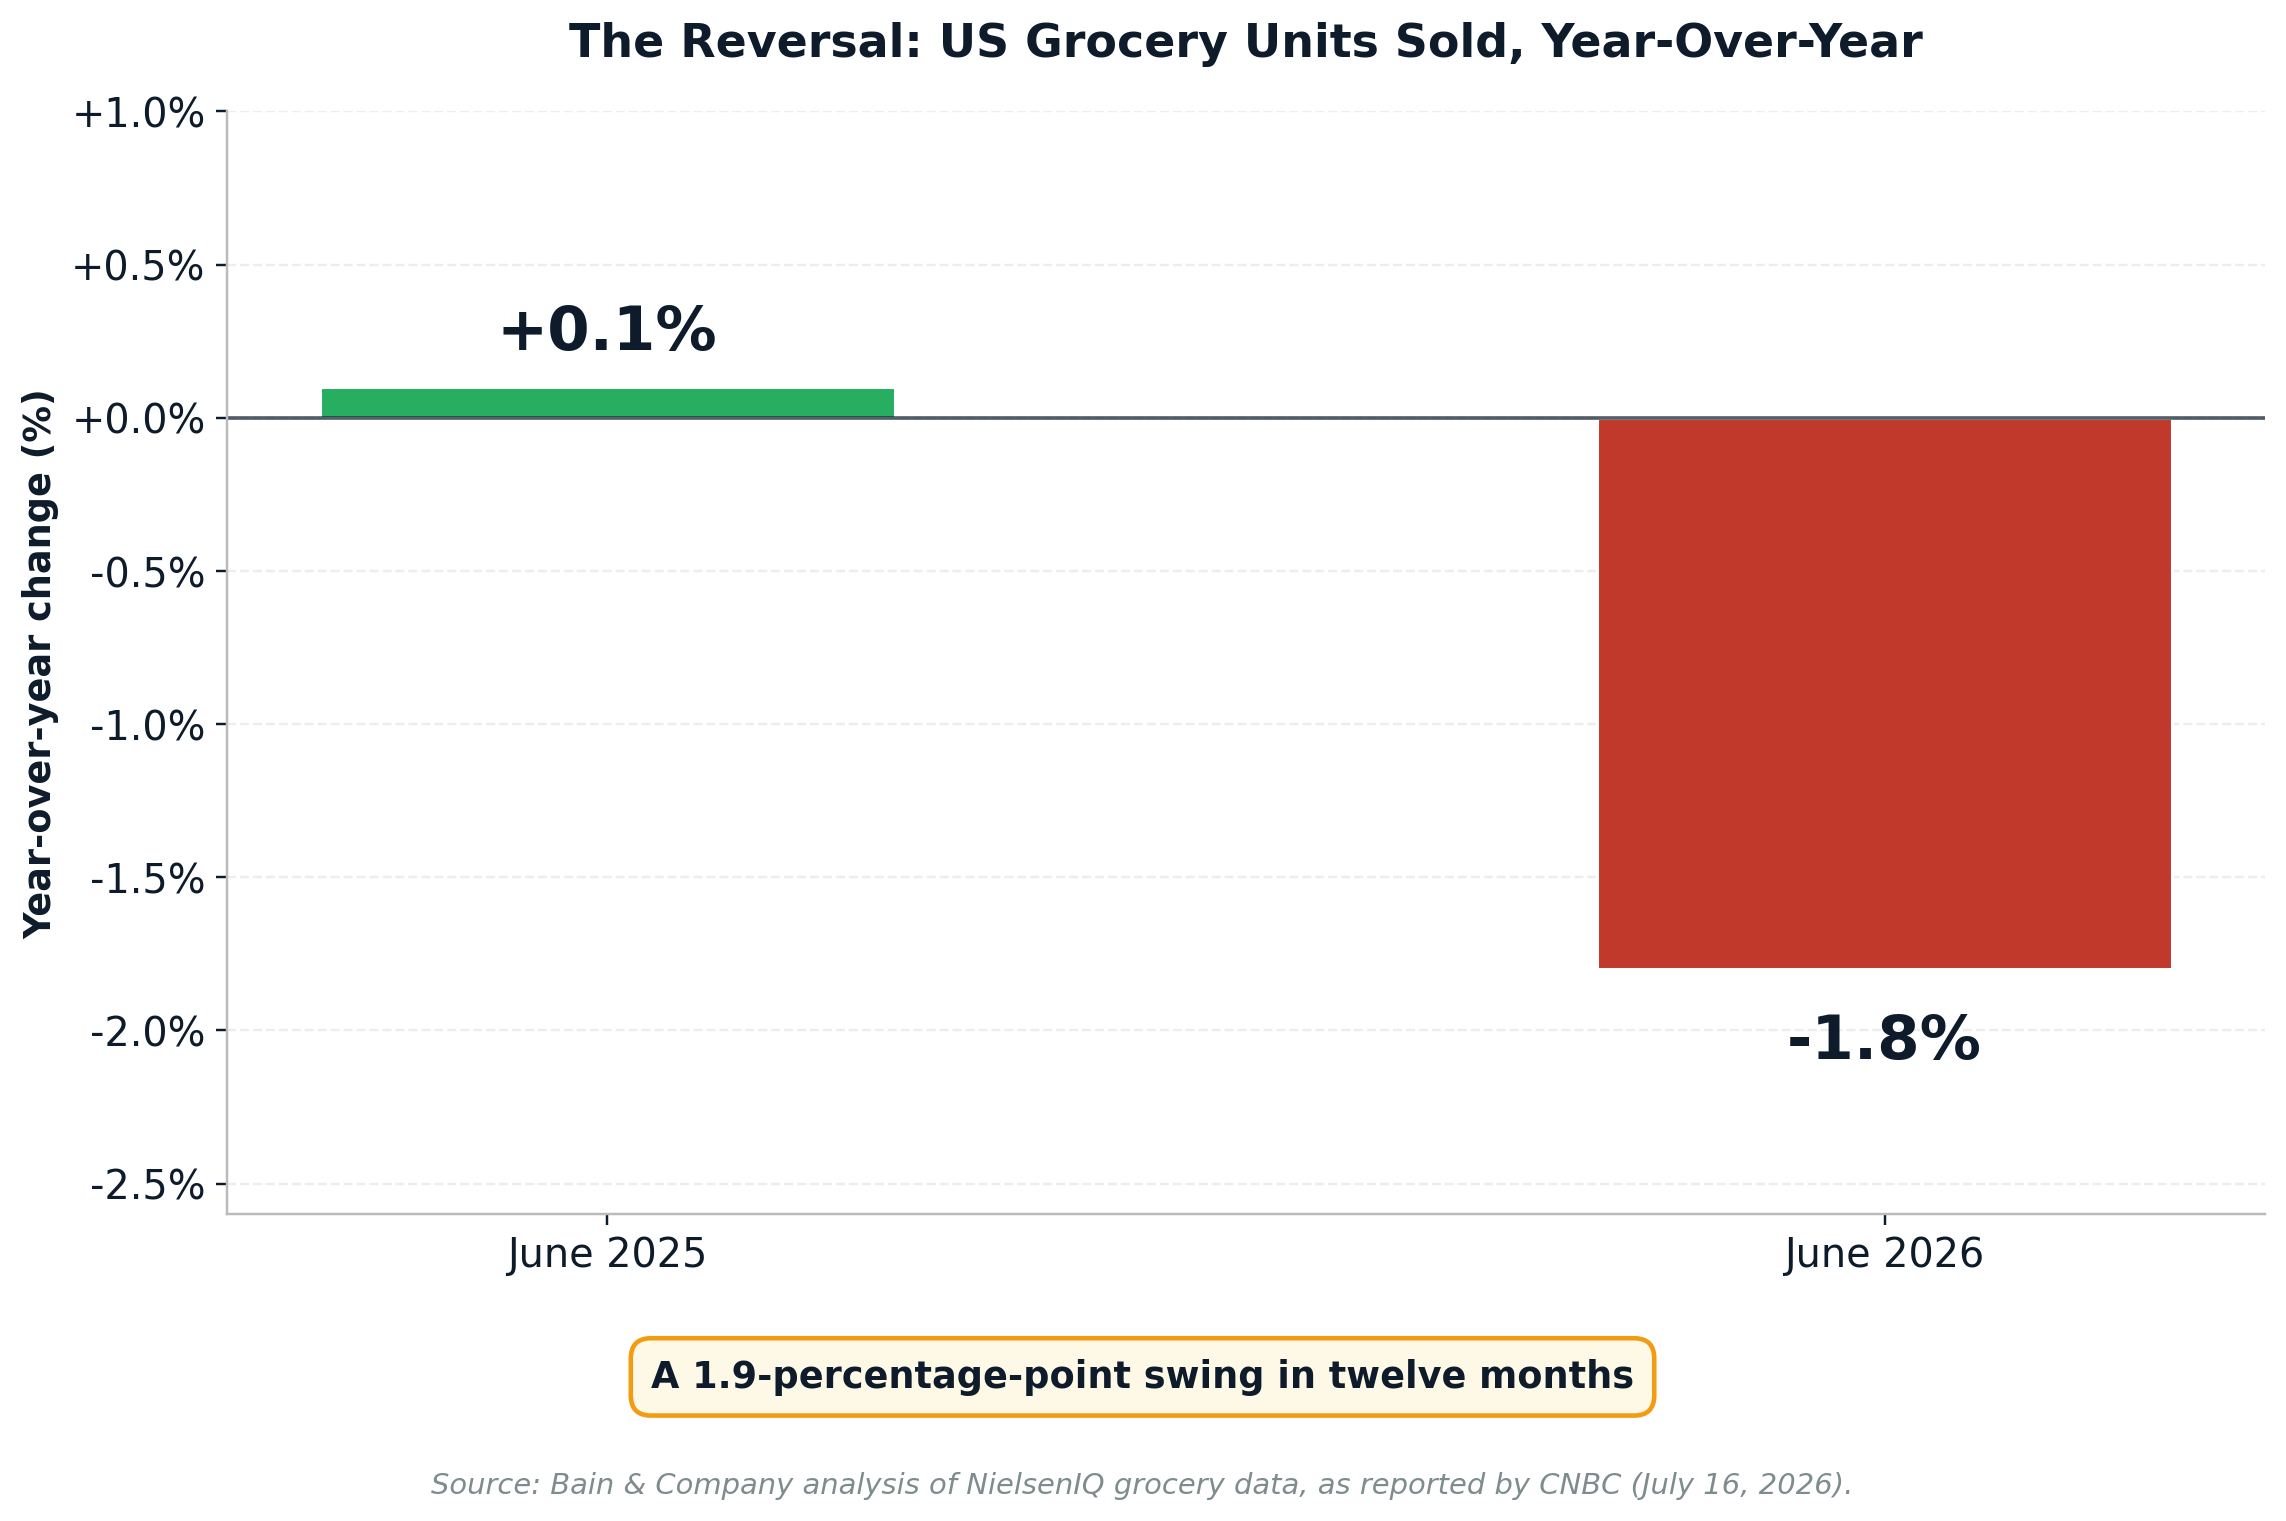
On July 16, 2026, CNBC published a Bain & Company analysis of NielsenIQ grocery data showing that unit sales at U.S. grocery stores fell 1.8 percent in June from a year earlier. One year prior, in June 2025, unit sales had grown 0.1 percent year-over-year. The 1.9 percentage-point swing means grocery inflation is no longer masking a broader softness in demand (CNBC, 2026).
Kurt Grichel, head of Bain’s Americas retail practice, framed the arithmetic for CNBC. “That big grocery stock up trip that costs you $300 in 2019, now costing you $400,” he said. “Even that upper-income consumer, you’re talking a big enough absolute dollar change that people start to feel a little bit of that sticker shock and start to shop around” (CNBC, 2026).
That characterization is close to what the federal price series shows. The Bureau of Labor Statistics food-at-home Consumer Price Index sat about 33 percent above its January 2019 level as of June 2026, and rose 2.7 percent year-over-year in June 2026 (U.S. Bureau of Labor Statistics, 2026). Wages have not kept pace. Real median household income was $83,730 in 2024, not statistically different from the 2023 estimate of $82,690 according to the Census Bureau (U.S. Census Bureau, 2025).
The Seven-Year Sticker Shock
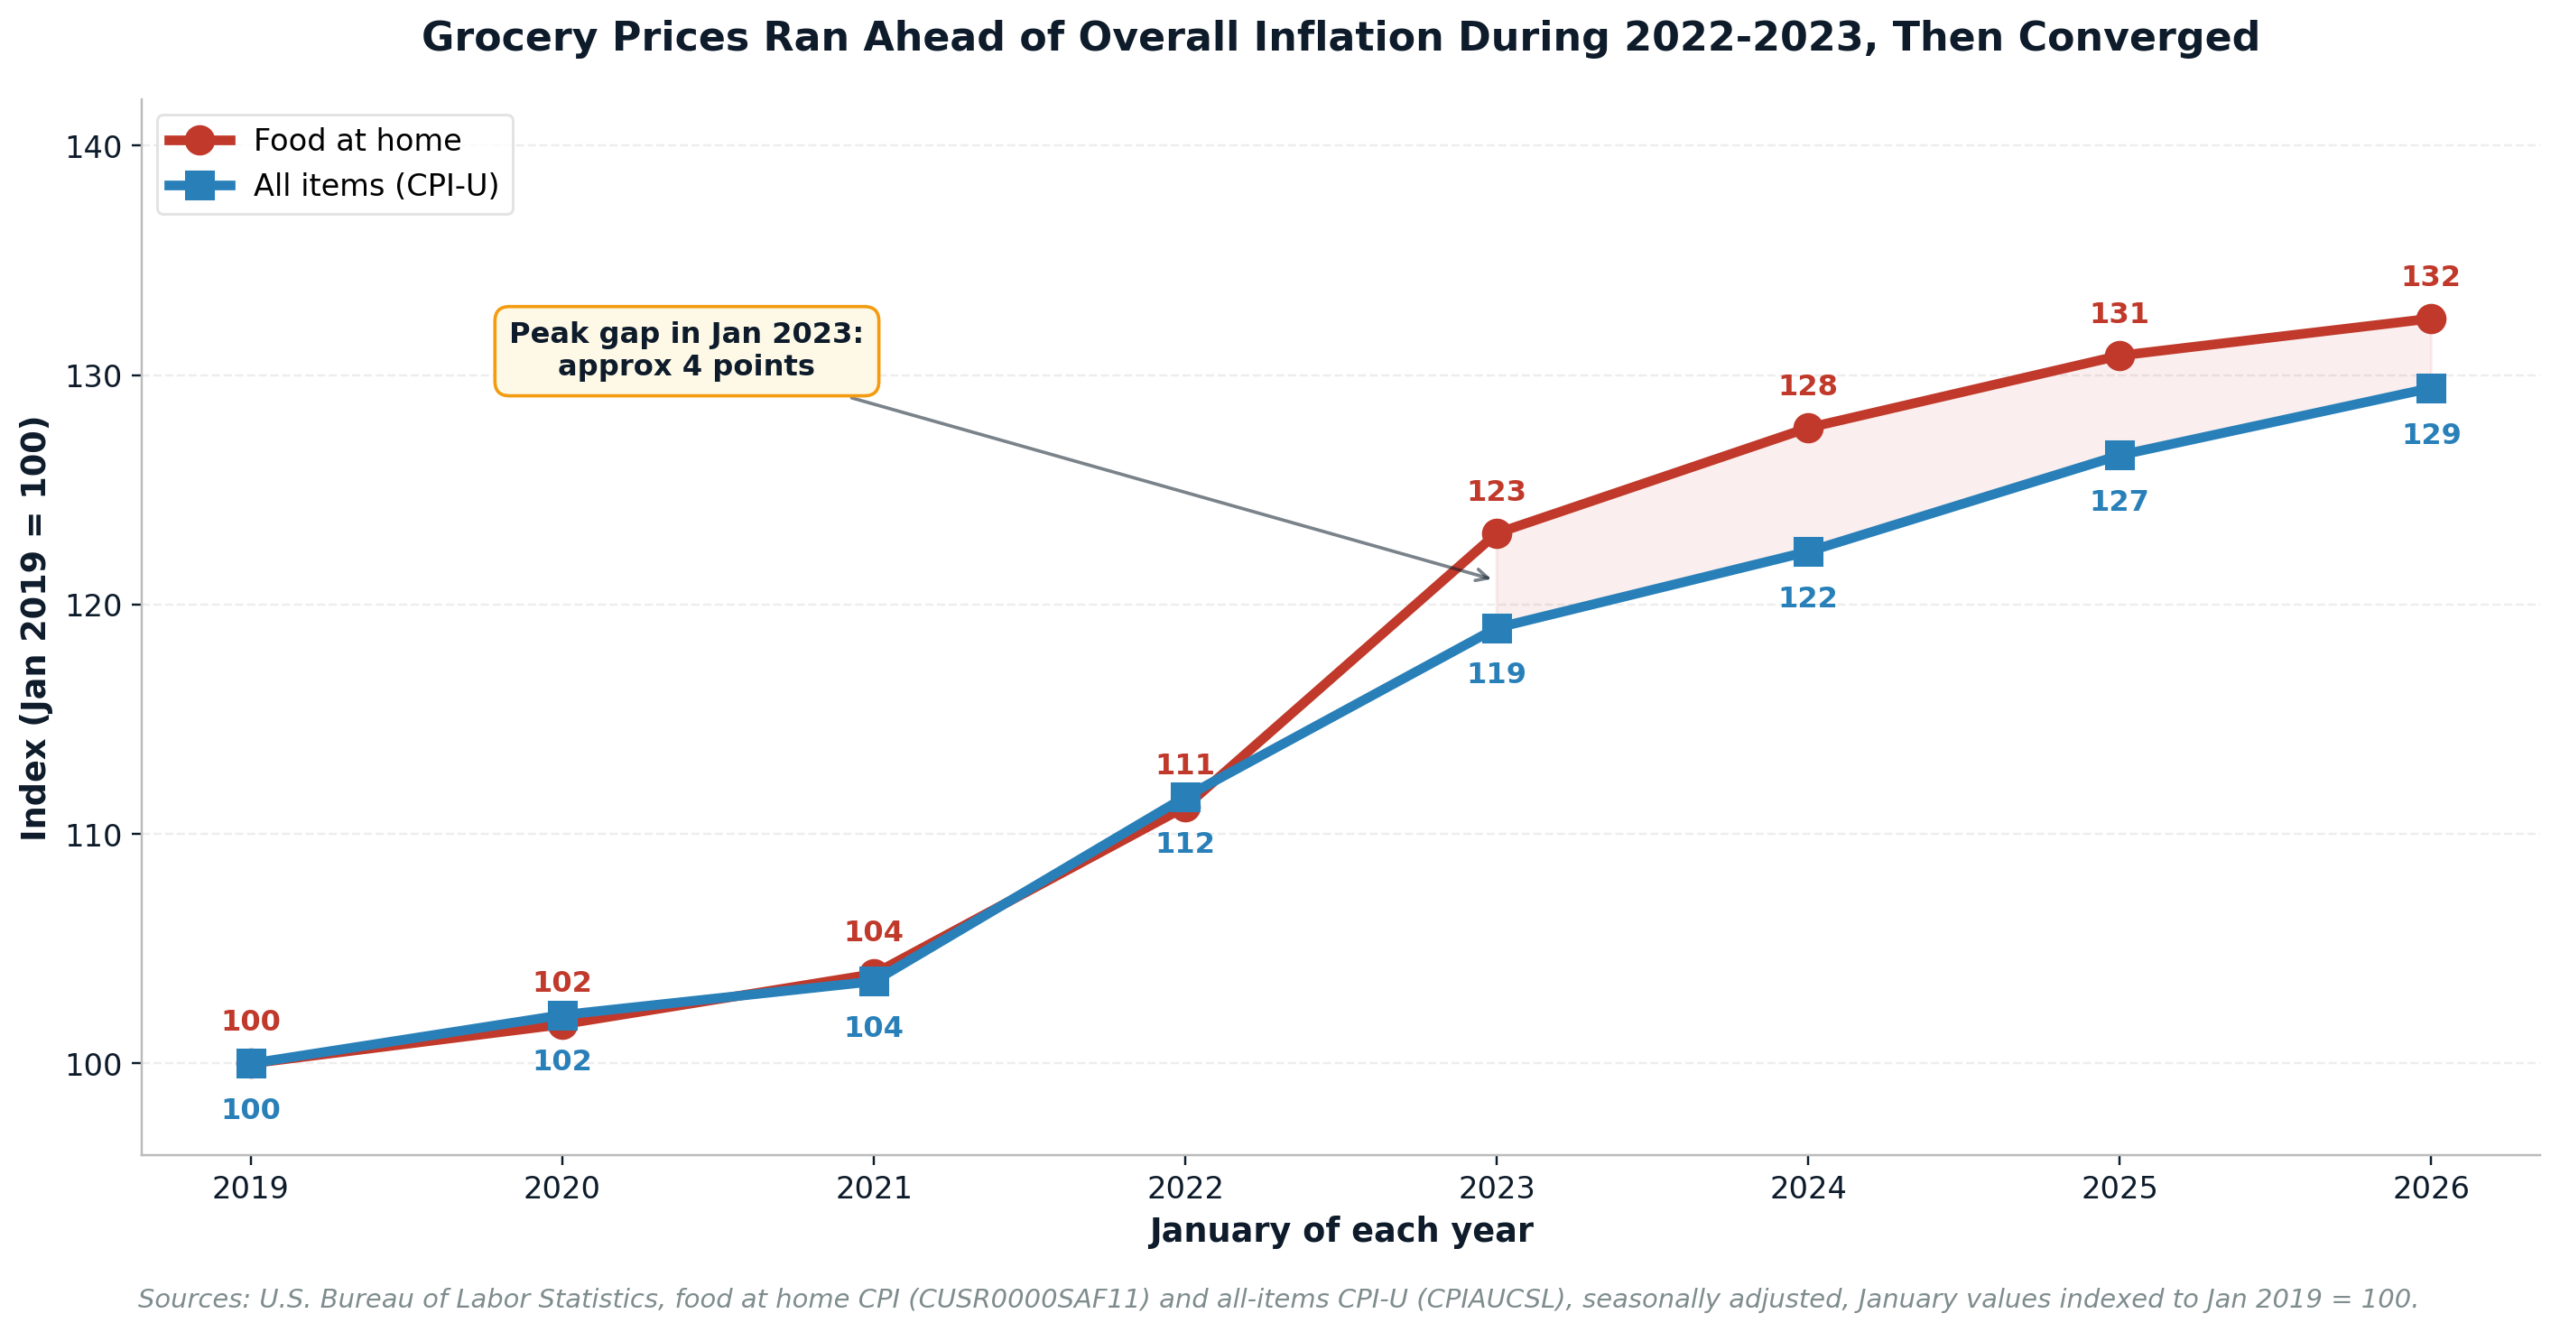
Grocery inflation ran meaningfully ahead of the broader Consumer Price Index during the 2022 and 2023 supply-disruption peak, and the two series have moved closer together since. Using the BLS food-at-home index and the all-items CPI-U at their January readings, food-at-home prices have risen approximately 33 percent since January 2019, and the overall CPI has risen approximately 32 percent (U.S. Bureau of Labor Statistics, 2026a; Federal Reserve Bank of St. Louis, 2026a). The remaining gap between the two series is small, but grocery categories now sit at the elevated level rather than reverting toward the pre-pandemic baseline.
Individual food categories tell a sharper story. Since January 2021, using BLS average retail price series through June 2026, ground beef prices are up about 72 percent, eggs are up about 46 to 50 percent depending on the reference month, chicken breast is up about 28 percent, and milk is up about 22 to 25 percent (Federal Reserve Bank of St. Louis, 2026b). The Department of Agriculture’s Economic Research Service forecasts a 2.8 percent increase in food-at-home prices for calendar 2026, with a prediction interval of 1.4 to 4.4 percent (U.S. Department of Agriculture, 2026).
The gasoline market added a separate strain during the second quarter of 2026. The national average price for regular unleaded gasoline reached $4.56 per gallon on May 21, 2026, a four-year high, following the disruption of Persian Gulf oil supply (American Automobile Association, 2026). PepsiCo chief executive Ramon Laguarta explicitly linked the pullback to fuel costs on the company’s July 9 earnings call. “I think the consumer is worse than what we had anticipated, and it’s driven mainly by gas prices,” he said (PepsiCo, 2026).
How Households Are Responding
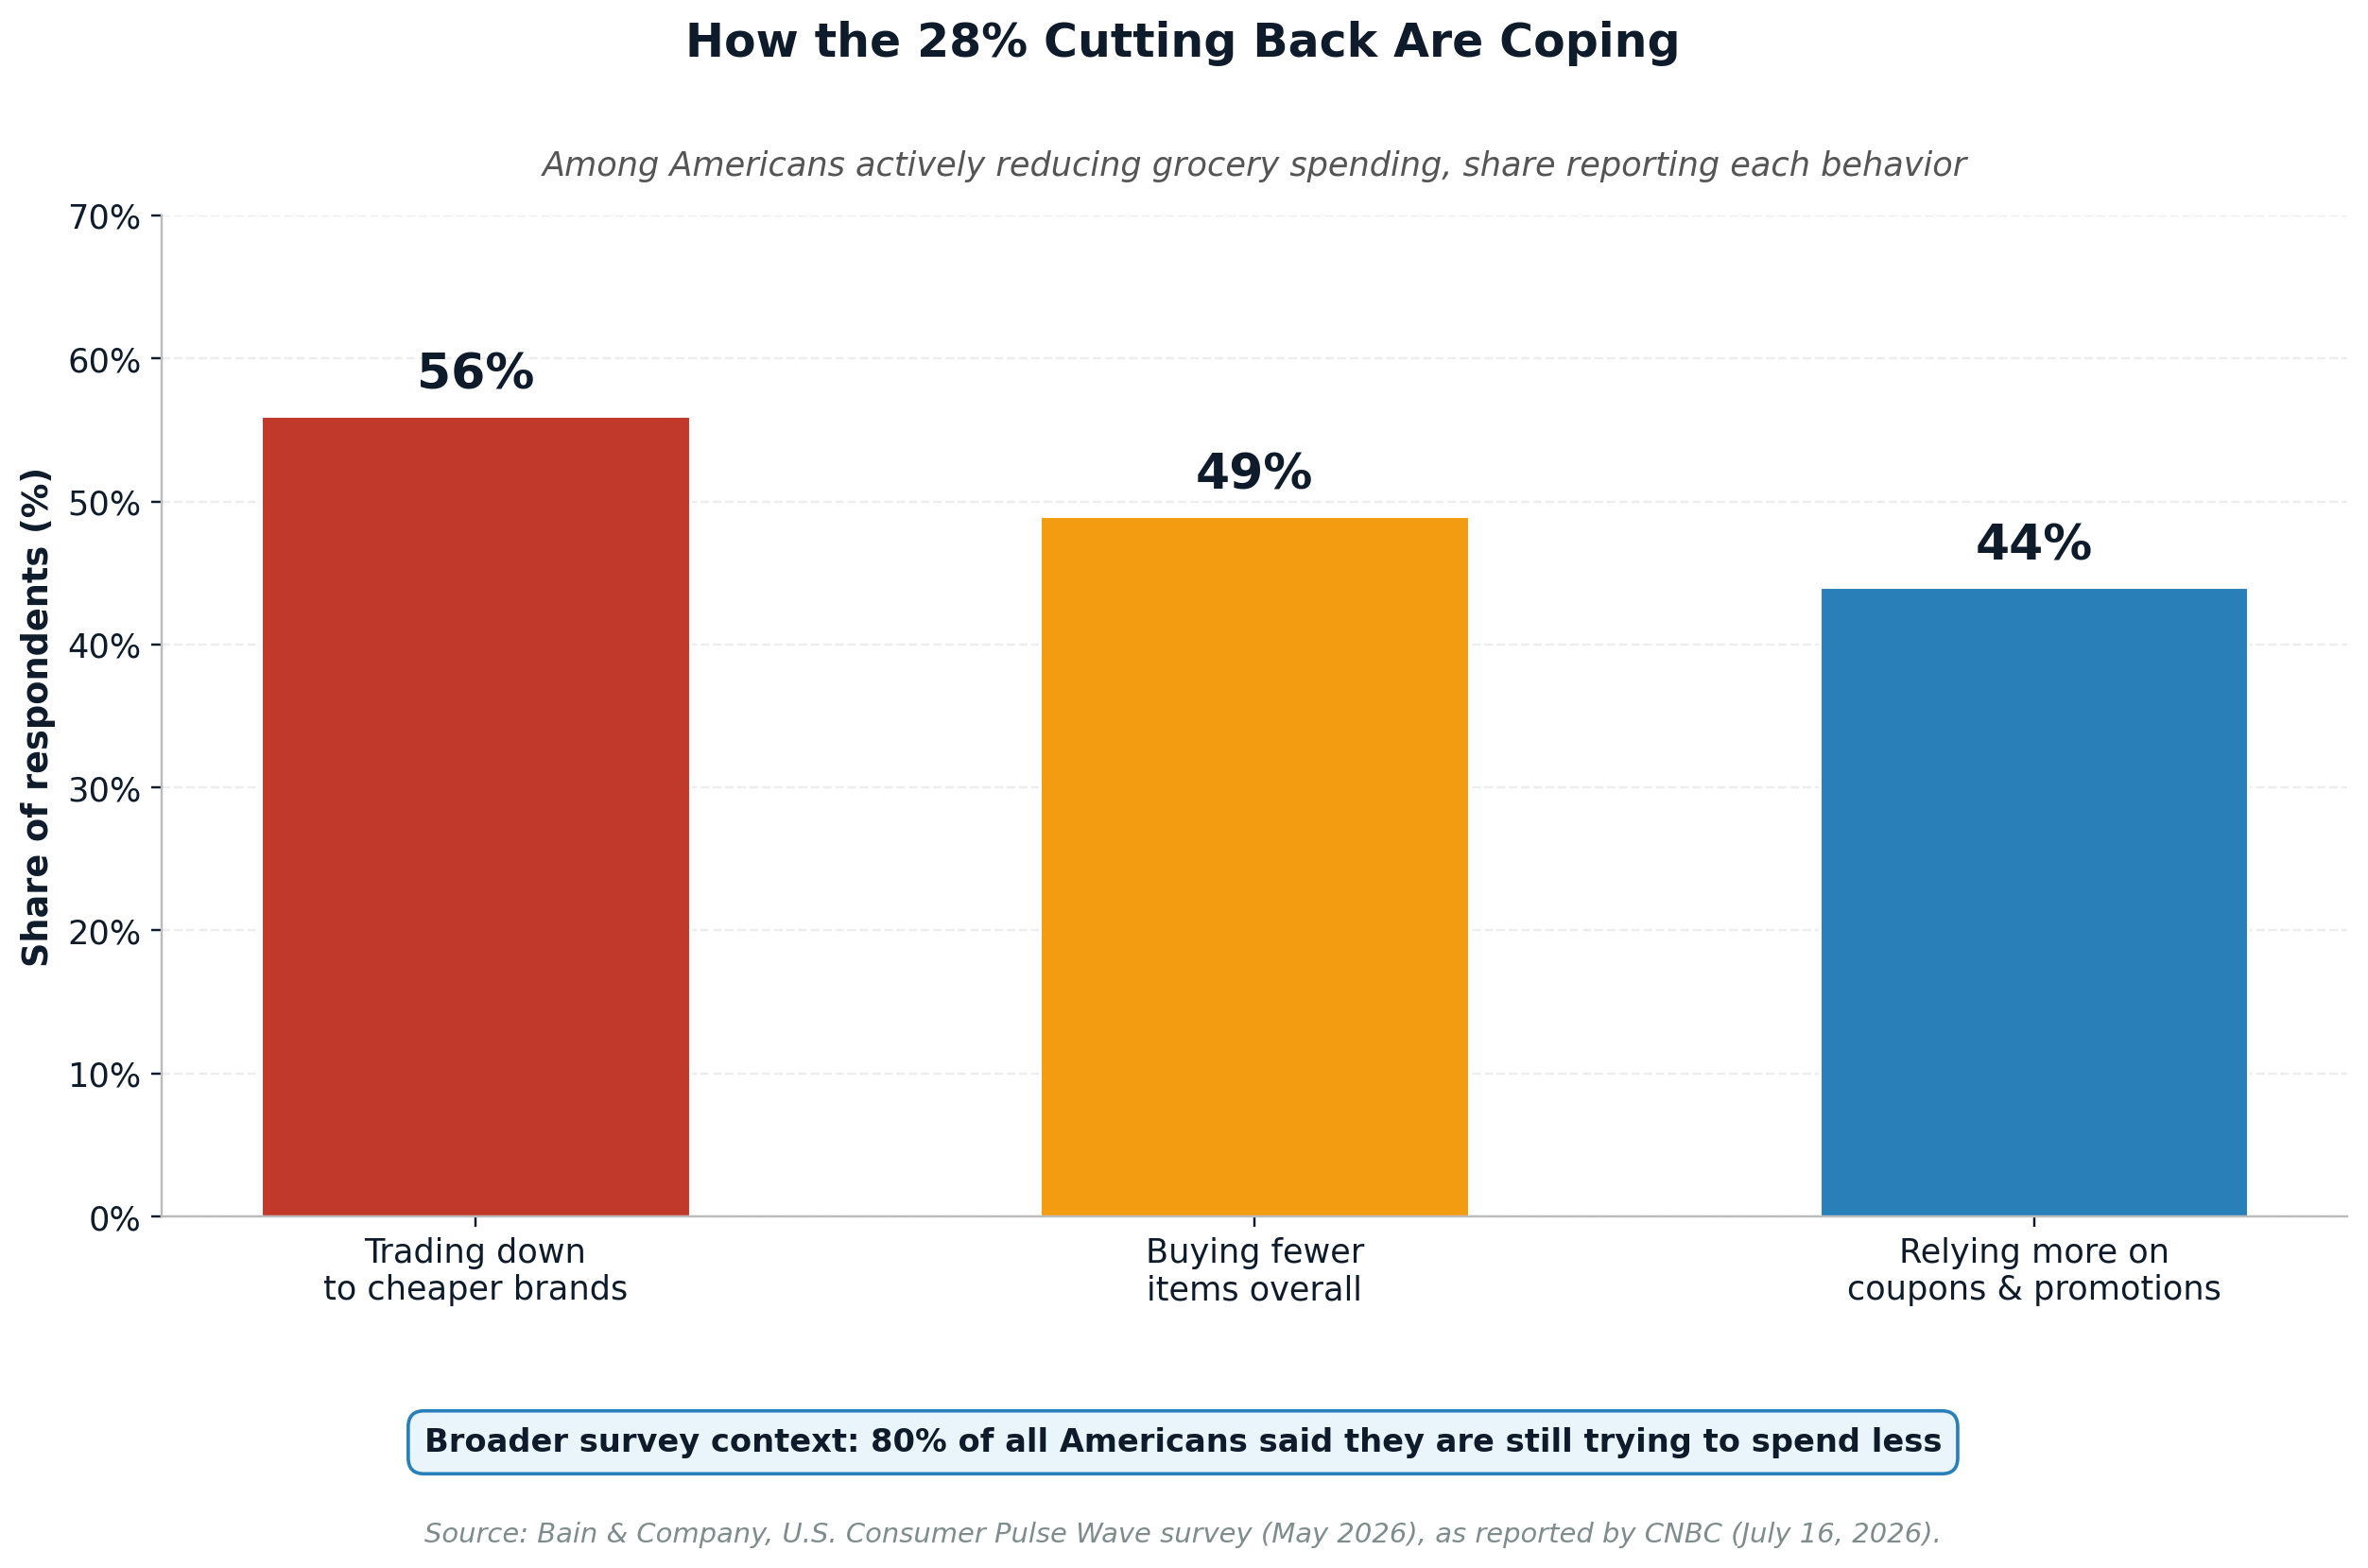
Bain & Company conducted its U.S. Consumer Pulse Wave survey in May 2026. Of respondents, 80 percent said they were still trying to spend less overall, and 28 percent said they were actively cutting back on grocery spending in particular. Among that 28 percent, 56 percent said they had traded down to cheaper brands, 49 percent said they were buying fewer items overall, and 44 percent said they were relying more heavily on coupons and promotions (CNBC, 2026).
Trading down to cheaper brands is showing up in the sales data. Private-label sales at U.S. retailers reached a record $282.8 billion in 2025, outpacing branded goods across all but one of Circana’s thirteen reporting periods that year, according to the Private Label Manufacturers Association (Private Label Manufacturers Association, 2026). Circana subsequently reported U.S. private-label CPG sales of about $330 billion on an expanded measurement basis, at 24 percent unit share and 23 percent dollar share, and FoodNavigator reported private-label share at 23.8 percent of U.S. grocery units sold (Circana, 2026; FoodNavigator, 2026).
The economic context. The One Big Beautiful Bill Act, signed by President Trump on July 4, 2025, cut roughly $186 billion from the Supplemental Nutrition Assistance Program over ten years, the largest single reduction in the program’s history. The Center on Budget and Policy Priorities estimates that about 3.5 million people lost SNAP benefits between July 2025 and February 2026 as tighter work requirements and age-band eligibility rules took effect (Center on Budget and Policy Priorities, 2026). For grocery retailers, SNAP recipients are among the most concentrated food-at-home buyers by dollar share, and any reduction in program benefits shows up first in unit sales.
The Corporate Response
PepsiCo’s second-quarter results, reported July 9, 2026, put the industry response in earnings-call language. Net revenue rose 6.4 percent to $24.18 billion, beating the analyst consensus of roughly $23.95 billion, driven by international operations. Core earnings per share of $2.20 missed the consensus estimate of $2.21 by a penny. North America foods revenue fell 2 percent, with volume flat, and executives cited lower effective net pricing as they increased promotional activity (PepsiCo, 2026a; PepsiCo, 2026b). Shares fell about 5 percent on the day.
Retailers have moved in parallel. Walmart announced summer price cuts on beef, ice cream, and other staples, including items produced by PepsiCo and Coca-Cola, as well as its own Great Value private label. Kroger has emphasized value-focused promotions in its most recent earnings communications (CNBC, 2026).
Joe Feldman, senior managing director and assistant director of research at Telsey Advisory Group, described the dynamic in the CNBC report. “The grocers have been pushing back on the suppliers to reduce prices where possible, and the suppliers recognize the need to do so,” he said. “The entire industry is trying to get back to unit growth, not just dollar growth” (CNBC, 2026; Telsey Advisory Group, 2026).
What the Data Does Not Say
A single month of unit sales is not a trend. The June 2026 figure of minus 1.8 percent is the sharpest reversal in recent NielsenIQ data, but the July and August prints will indicate whether the pullback is broadening or beginning to normalize. Grocery unit demand is also seasonal and holiday-linked, which the year-over-year comparison partially controls but does not eliminate.
Consumer credit stress remains manageable at the aggregate. Credit card delinquency rates at commercial banks were 2.92 percent in the first quarter of 2026, elevated versus the pre-pandemic norm but below the peak reached in recent years, and household debt balances continued to grow at a moderate pace, according to the Federal Reserve Bank of New York (Federal Reserve Bank of St. Louis, 2026; Federal Reserve Bank of New York, 2026). This report does not conclude that a consumer recession is underway. It records that grocery spending, historically one of the least discretionary categories in the household budget, has begun to soften.
Attribution of the slowdown across its likely drivers (cumulative price inflation, gas prices, SNAP eligibility changes, private-label substitution, general income constraint) is not resolved by the data cited here. Bain, PepsiCo, and CNBC identified the same three or four factors that this report has verified, but the relative weight of each is a matter for further econometric work, not for assumption.
What to Watch
Four measurable series will indicate whether the June 2026 grocery reversal deepens or fades.
- BLS CPI food-at-home, monthly release. If food-at-home inflation runs above the USDA ERS 2.8 percent forecast for 2026, the affordability squeeze widens. If it moderates below 2 percent, the price ceiling begins to relieve.
- NielsenIQ and Circana unit data. A second consecutive month of negative year-over-year unit growth would confirm the June reversal as a trend rather than a one-print anomaly.
- Private-label unit share. A private-label share moving past 25 percent of grocery units would indicate a durable structural shift rather than a cyclical trade-down.
- Packaged-food company earnings. Second-half 2026 results from PepsiCo, General Mills, Conagra, Kraft Heinz, and Campbell’s will show whether volume weakness spreads beyond snacks and beverages.
Bottom line. The federal price data are unambiguous. Grocery prices are roughly 35 percent higher than they were in 2019, and household income has not kept pace. Bain and NielsenIQ have now recorded the first meaningfully negative year-over-year unit-sales print in the current cycle. Whether this is a June anomaly or an inflection depends on the July and August data. Either way, the packaged-food industry has begun to reprice its own goods downward through promotions, and the grocery aisle has become the clearest place to observe where American household budgets are binding.
References
American Automobile Association. (2026, May 21). Memorial Day weekend gas prices reach four-year highs. https://gasprices.aaa.com/memorial-day-weekend-gas-prices-reach-four-year-highs/
Center on Budget and Policy Priorities. (2026, March). Tracking the impact of the 2025 SNAP cuts. https://www.cbpp.org/research/food-assistance/tracking-the-impact-of-the-2025-snap-cuts
Circana. (2026, March 31). Circana’s research reveals U.S. private label CPG sales reach $330 billion. https://www.circana.com/post/circana-research-reveals-u-s-private-label-cpg-sales-reach-330-billion
CNBC. (2026, July 16). U.S. grocery slowdown deepens as shoppers buy fewer items, raising pressure on food companies. https://www.cnbc.com/2026/07/16/us-grocery-spending-slows-in-hit-to-food-companies.html
Federal Reserve Bank of New York. (2026, May 12). Household debt balances rise slightly as delinquency rates hold steady. Center for Microeconomic Data. https://www.newyorkfed.org/newsevents/news/research/2026/20260512
Federal Reserve Bank of St. Louis. (2026). Delinquency rate on credit card loans, all commercial banks [DRCCLACBS]. FRED. https://fred.stlouisfed.org/series/DRCCLACBS
FoodNavigator. (2026, July 9). Private label widens lead over national brands in 2026 grocery unit sales. https://www.foodnavigator.com/Article/2026/07/09/private-label-widens-lead-over-national-brands-in-2026-grocery-unit-sales/
PepsiCo. (2026a, July 9). PepsiCo reports second-quarter 2026 results [Earnings release]. https://investors.pepsico.com/docs/pepsico-5v9wci20/media/Files/investors/q2-2026-earnings-release.pdf
PepsiCo. (2026b, July 9). CNBC coverage of PepsiCo’s Q2 2026 earnings call. https://www.cnbc.com/2026/07/09/pepsico-pep-q2-2026-earnings.html
Private Label Manufacturers Association. (2026, January). Store brands: A bright beacon, 2026 annual report. https://www.plma.com/sites/default/files/files/2026-01/plma-2026-report.pdf
Telsey Advisory Group. (2026). Joseph Feldman, senior managing director and assistant director of research. https://www.telseygroup.com/team/joseph-feldman/
U.S. Bureau of Labor Statistics. (2026, July 14). Consumer Price Index summary, June 2026. https://www.bls.gov/news.release/cpi.nr0.htm
U.S. Bureau of Labor Statistics. (2026a). Food at home in U.S. city average, seasonally adjusted [CUSR0000SAF11]. https://fred.stlouisfed.org/series/CUSR0000SAF11
Federal Reserve Bank of St. Louis. (2026a). Consumer Price Index for all urban consumers: All items in U.S. city average [CPIAUCSL]. FRED. https://fred.stlouisfed.org/series/CPIAUCSL
Federal Reserve Bank of St. Louis. (2026b). Average price: Retail food commodities [BLS series APU0000703112, APU0000708111, APU0000FF1101, APU0000709112]. FRED. https://fred.stlouisfed.org/categories/32218
U.S. Census Bureau. (2025, September 9). Income in the United States: 2024 (Report Number P60-286). https://www.census.gov/library/publications/2025/demo/p60-286.html
U.S. Department of Agriculture. (2026, June 25). Food price outlook: Summary findings. Economic Research Service. https://www.ers.usda.gov/data-products/food-price-outlook/summary-findings