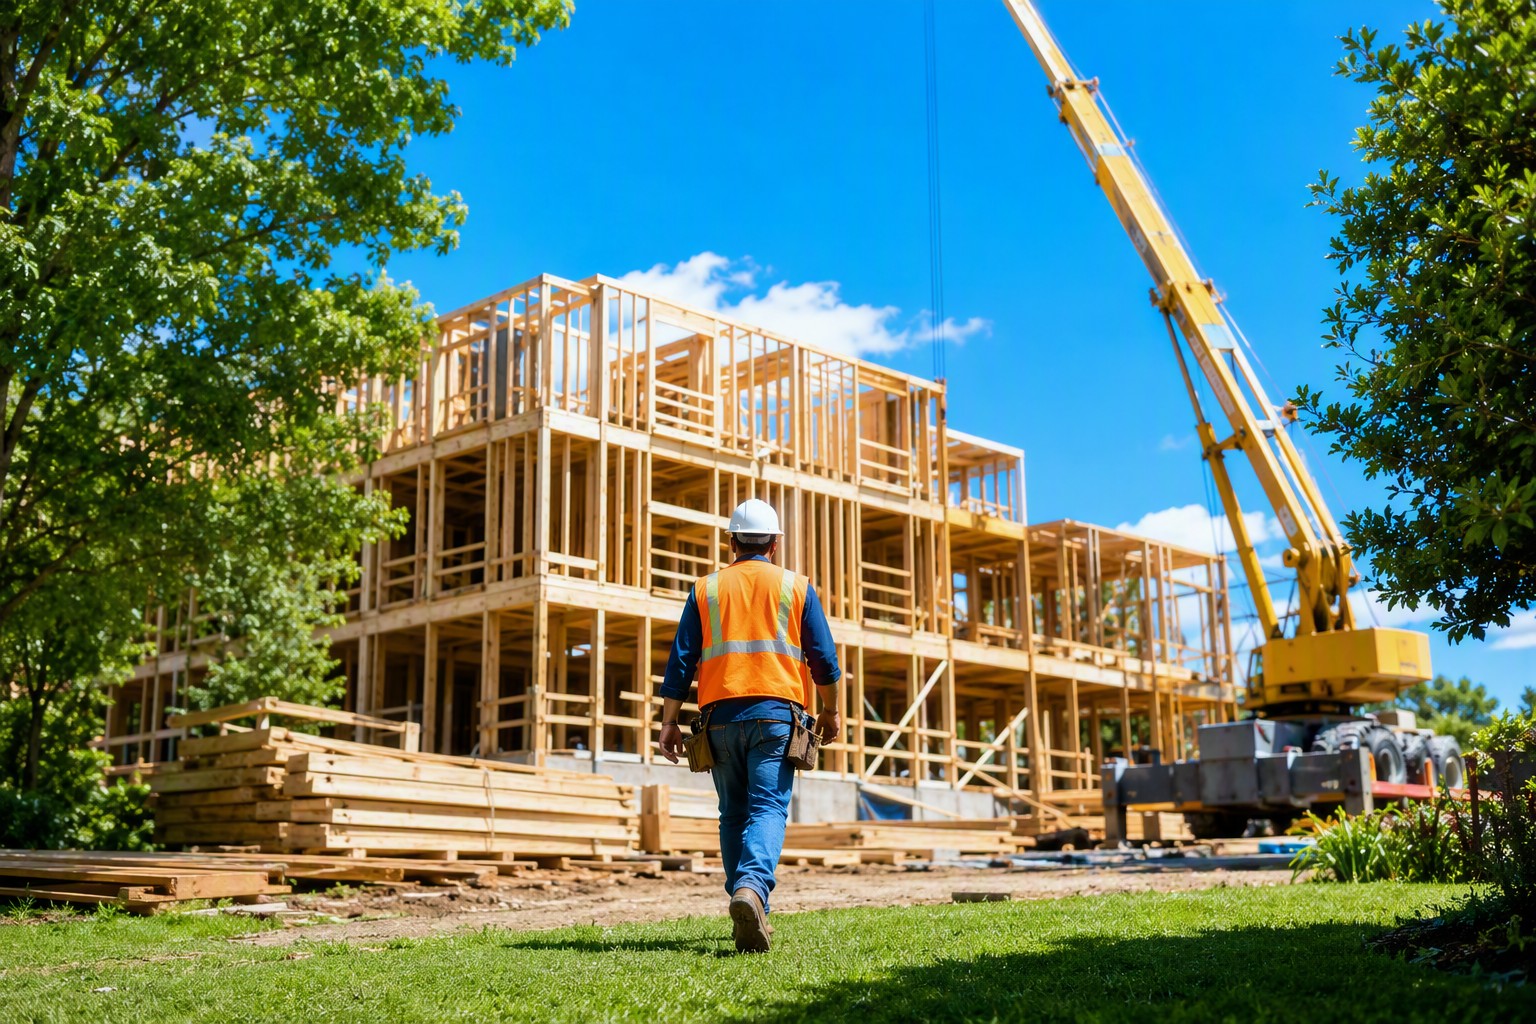

Executive Summary
The first baby boomers turn 80 in 2026. In the same year, senior housing construction fell to its lowest level since 2012. Units under construction across NIC MAP primary markets number fewer than 16,000, construction starts over the trailing twelve months are below 7,000 units, and net inventory growth on a rolling four-quarter basis is under 3,000 units — the lowest in the twenty-year history of the dataset (NIC MAP Vision, 2026a, 2026b).
Demand is moving the other way. Occupancy reached 89.5 percent in the first quarter of 2026, the nineteenth consecutive quarterly increase, and more than half of primary markets now have no development underway at all (NIC, 2026).
Key finding. This is not a market failing to notice its customers. Development costs have reached roughly $388,830 per unit, the build cycle has stretched to 29 months, and financing is largely unavailable. More decisively, the demographic demand is not all effective demand: at $4,000 to $8,000 a month, the units the population needs sit above what much of that population can pay. The shortfall is an arithmetic problem in the middle of the market, not an information problem at the top of it.
Two facts that sound contradictory are both true: the population is ageing faster than at any point in modern American history, and the industry built to house it is constructing less than it has in fourteen years. The reconciliation is uncomfortable, and it is mostly about price.
The Supply Collapse Is Real, and Deeper Than the Headline
The fourteen-year figure refers to units under construction, which have fallen to their lowest level since 2012. Taken alone it would be striking. The surrounding measures are worse.
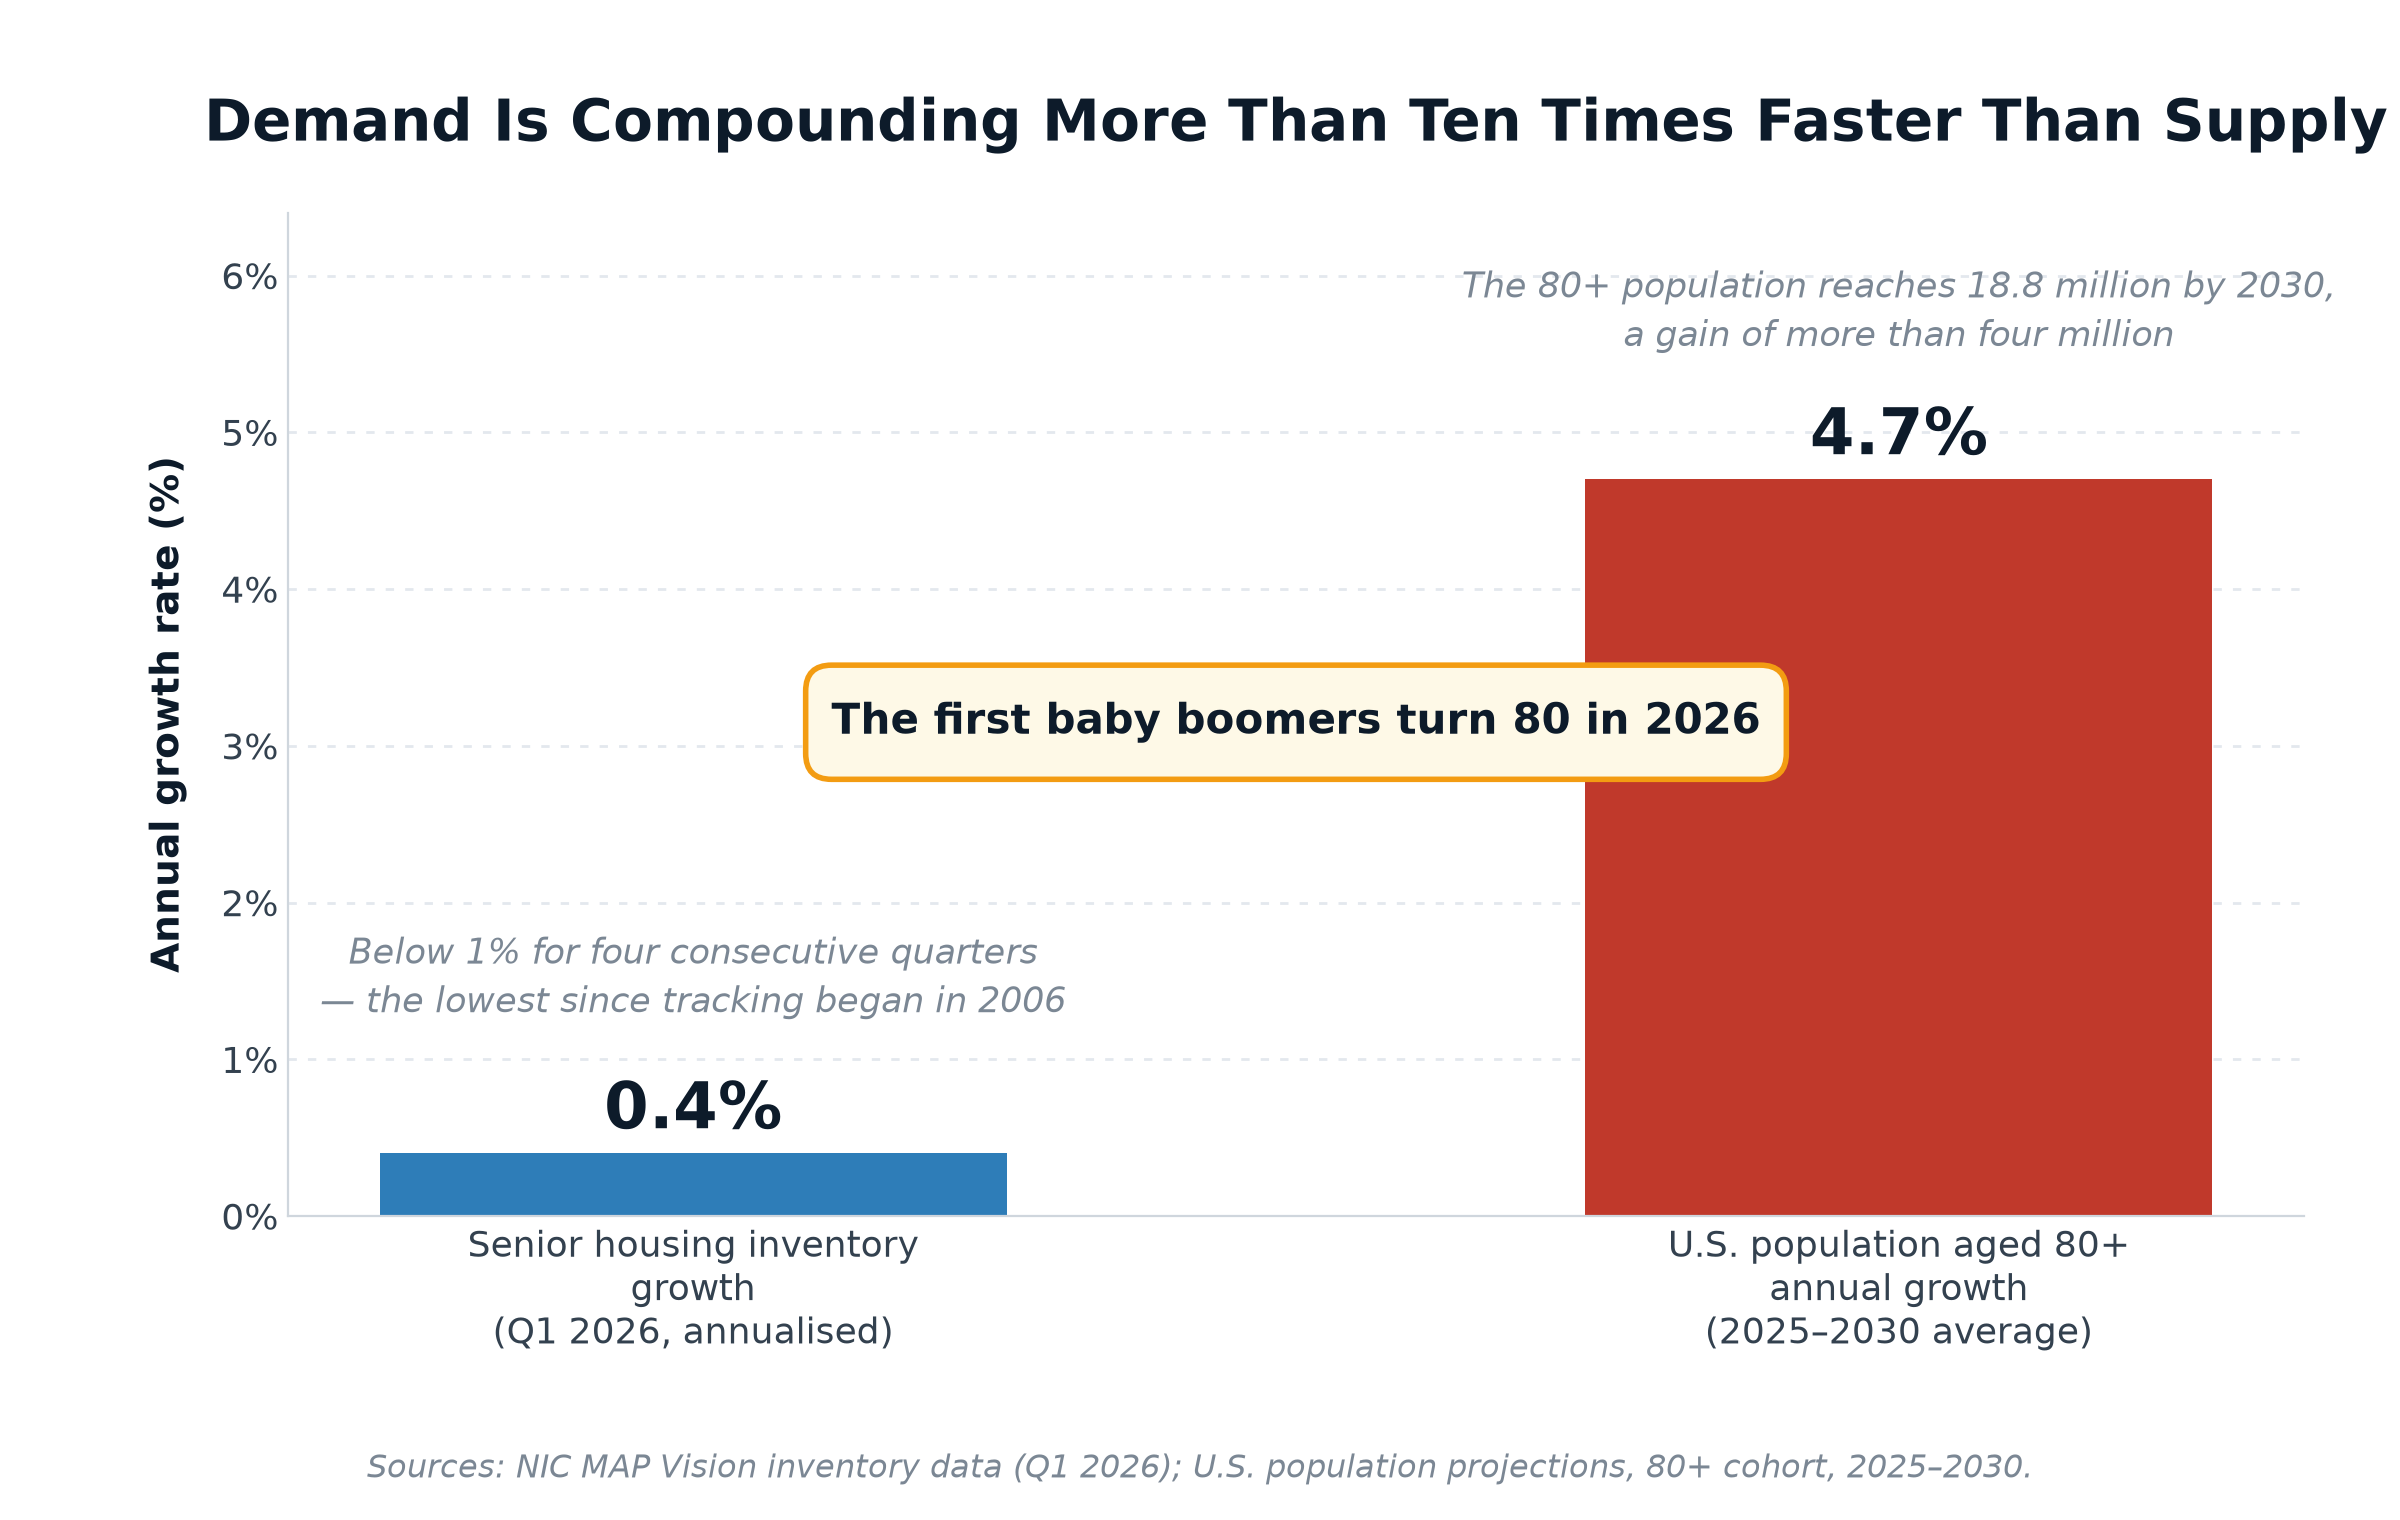
Construction starts across NIC MAP primary markets totalled fewer than 7,000 units over the trailing twelve months. Net inventory growth — completions minus removals, the number that actually determines how many beds exist — came in under 3,000 units on a rolling four-quarter basis, which NIC MAP describes as the lowest annual inventory growth in the twenty-year history of its data. Inventory growth has now been below one percent for four consecutive quarters, the weakest stretch since the organisation began tracking supply in 2006. The first quarter of 2026 added just 0.4 percent (NIC MAP Vision, 2026a, 2026b).
The distributional detail is the most telling: more than half of NIC MAP primary markets have no senior housing development underway whatsoever. This is not a slowdown concentrated in a few overbuilt metros. It is a near-stop across most of the country.
Demand Is Accelerating on Schedule
Nothing about the demographic side is surprising or disputed. The leading edge of the baby boom reaches 80 in 2026 — the age at which senior housing demand historically begins in earnest. The 80-and-over population is projected to grow at roughly 4.7 percent annually through 2030, and the 85-and-over cohort at about 3.8 percent, taking the 80-plus population past 18.8 million by 2030, a gain of more than four million people.
The occupancy data confirms the demand is showing up. Senior housing occupancy rose to 89.5 percent in the first quarter of 2026 from 89.1 percent in the fourth quarter of 2025 — the nineteenth consecutive quarter of increase, with more than half of primary markets now above 90 percent (NIC, 2026). Rising occupancy against near-zero new supply is what a tightening market looks like from the inside.
The Size of the Gap
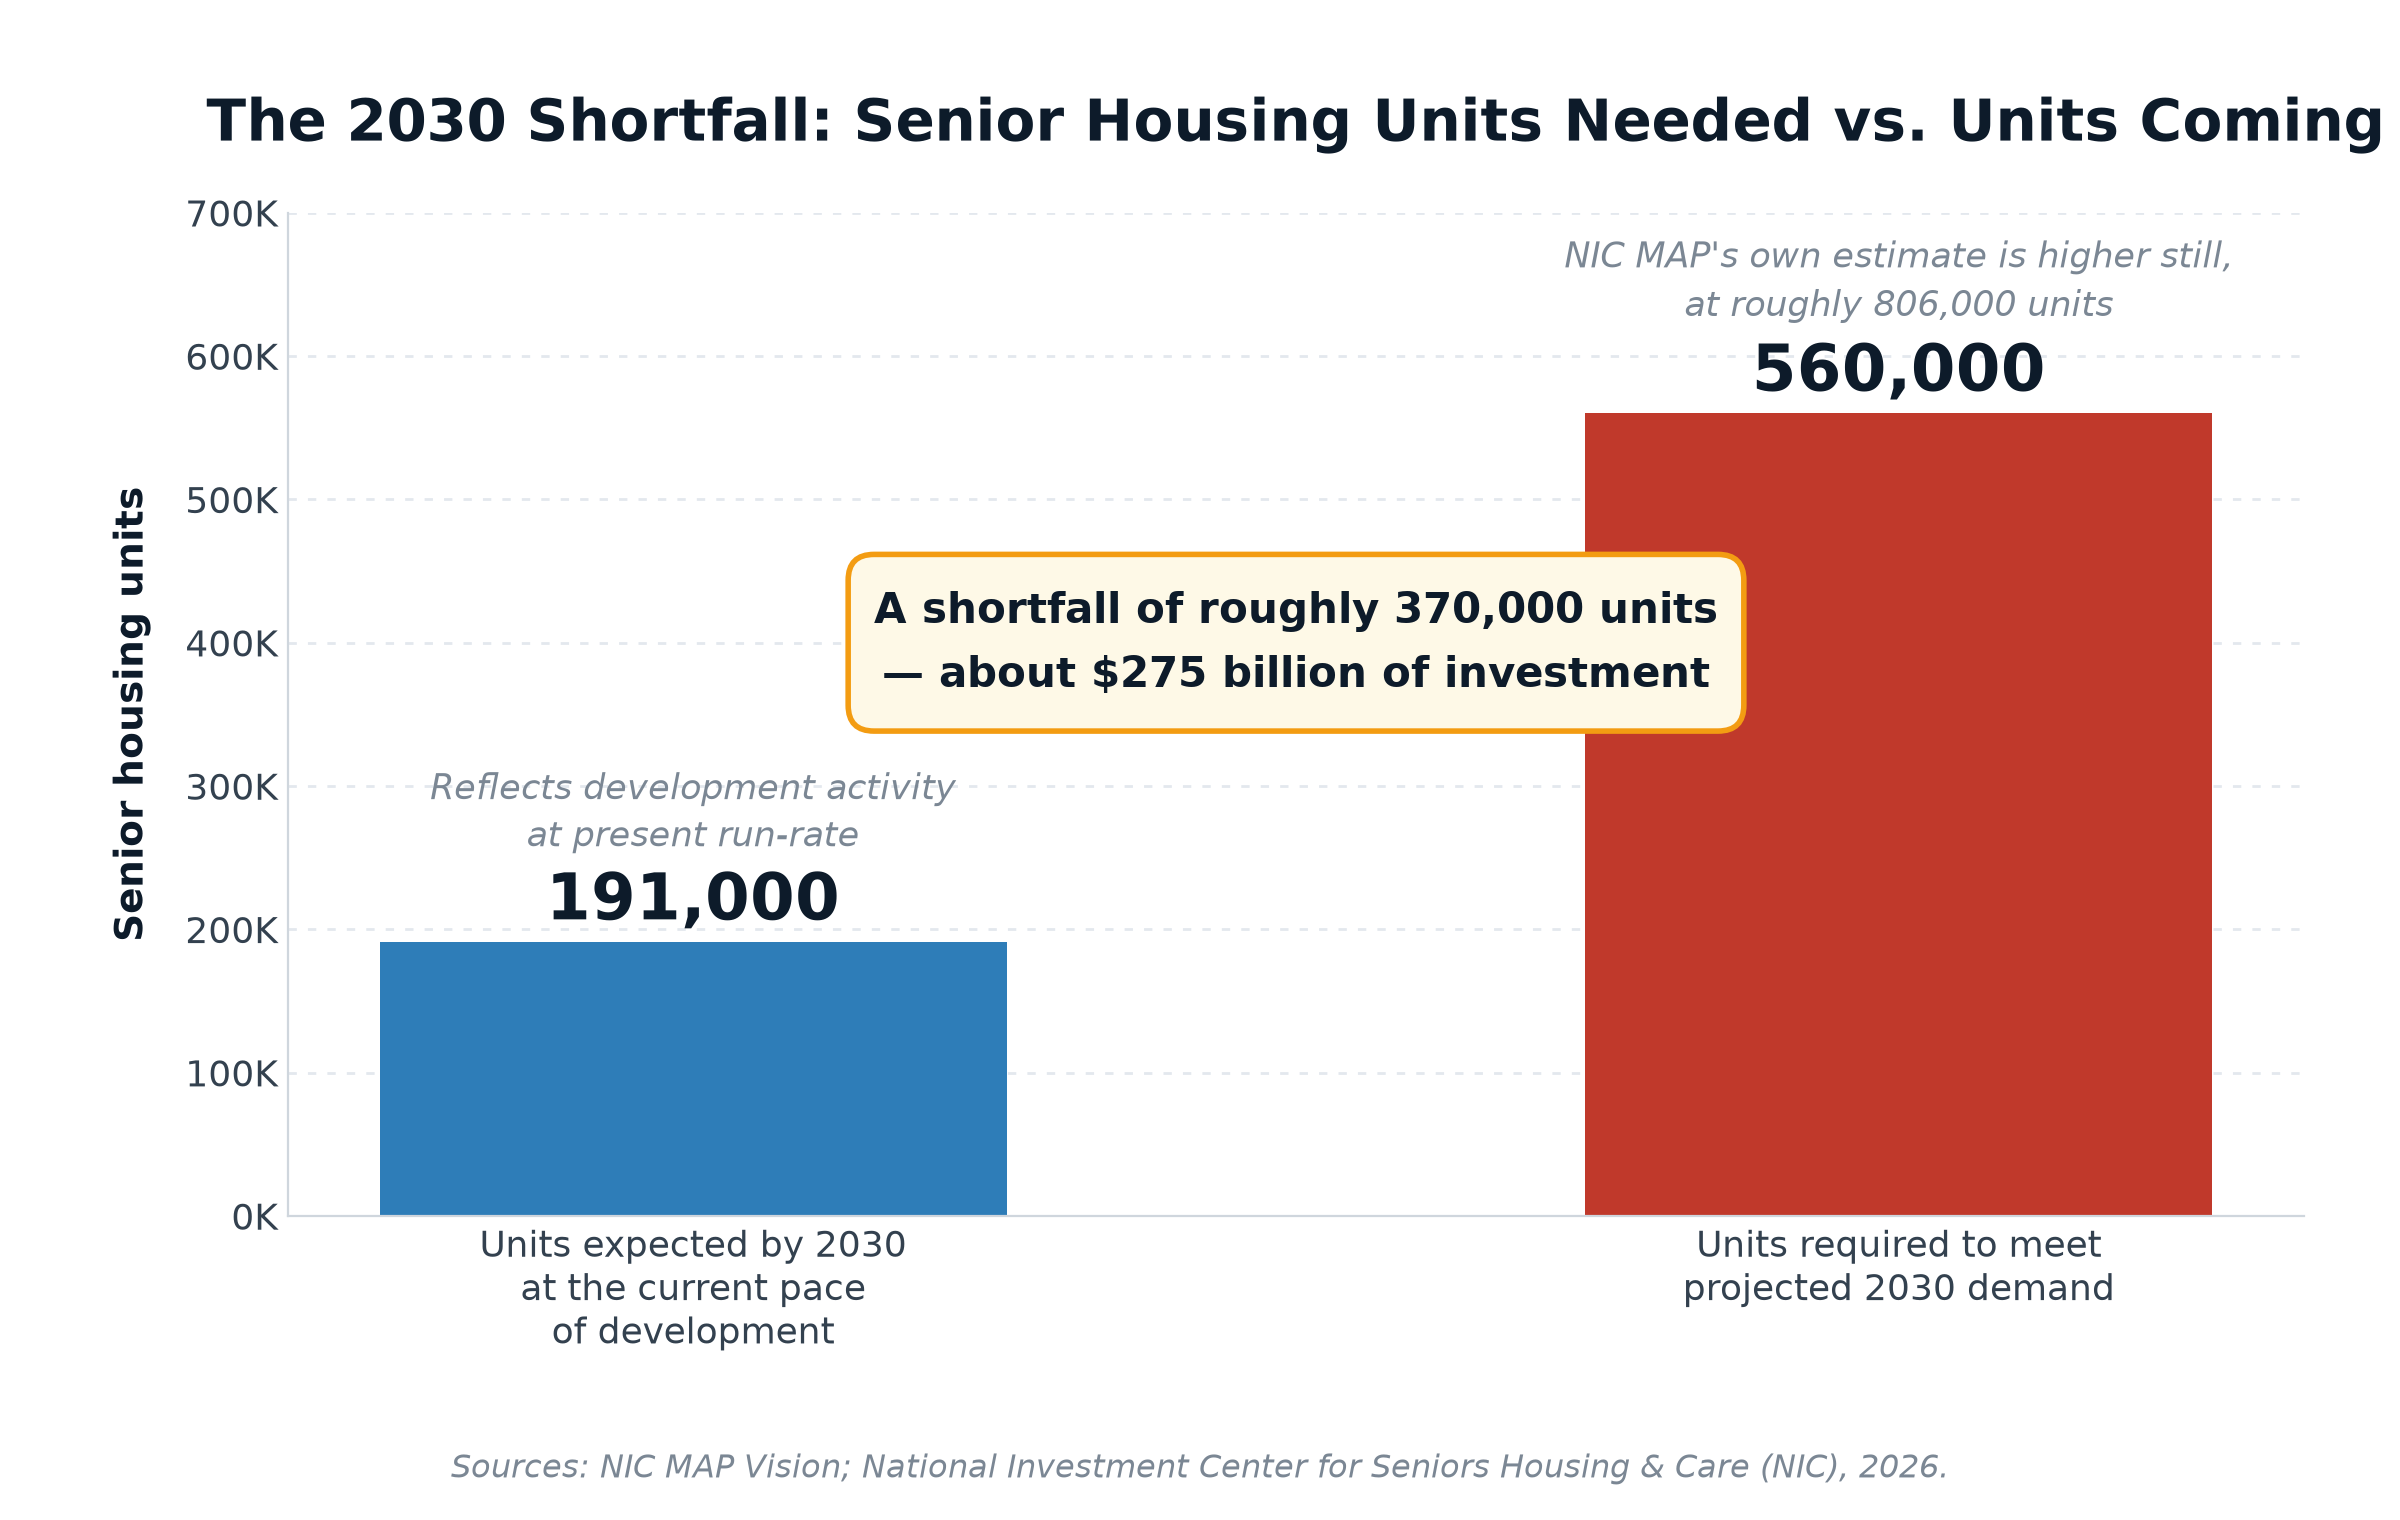
Estimates of what is required differ, but not in direction. One widely cited forecast puts the need above 560,000 new units by 2030 against roughly 191,000 that would be delivered at the current pace. NIC MAP’s own estimate is larger still, at approximately 806,000 additional units, implying an investment shortfall on the order of $275 billion through 2030.
These are projections built on assumptions about penetration rates — what share of the 80-plus population will use congregate senior housing rather than ageing at home with support. That assumption is doing considerable work, and this report returns to it below.
Why Developers Are Not Building Into Obvious Demand
The reflex explanation — that the industry is missing an obvious opportunity — does not survive contact with the cost structure. Three constraints bind, and they compound.
Construction economics have deteriorated sharply. Between the third quarter of 2023 and the second quarter of 2026, average senior housing development cost reached roughly $388,830 per revenue unit, or about $364 per square foot (Senior Housing News, 2026a). Tariffs on building materials and a shortage of construction labour have both contributed. Notably, this is the same trades constraint documented in this publication’s earlier report on the AI data centre buildout — senior housing developers and hyperscale data centre developers are bidding for the same electricians, pipefitters, and mechanical contractors (AcadeResearch, 2026).
Financing is largely unavailable. Lenders retreated from the sector after the rate shock and have not returned at scale. Projects are being underwritten on the assumption of no policy relief, which keeps borrowing costs high and hurdle rates higher. The construction cycle has stretched to about 29 months, meaning a project breaking ground today opens in 2028 — a long time to hold exposure on an asset class where memories of the 2020 occupancy collapse are still fresh (Senior Housing News, 2026b, 2026c).
And the demand does not clear at the price required. This is the binding constraint, and it receives the least attention.
The Affordability Wall
Monthly costs run from over $4,000 in continuing care retirement communities to more than $8,000 in memory care. A growing share of households simply lack the financial capacity to make that move, and industry analysts have been explicit that future demand may not translate into realised occupancy in the middle-market segment (NIC MAP Vision, 2026c).
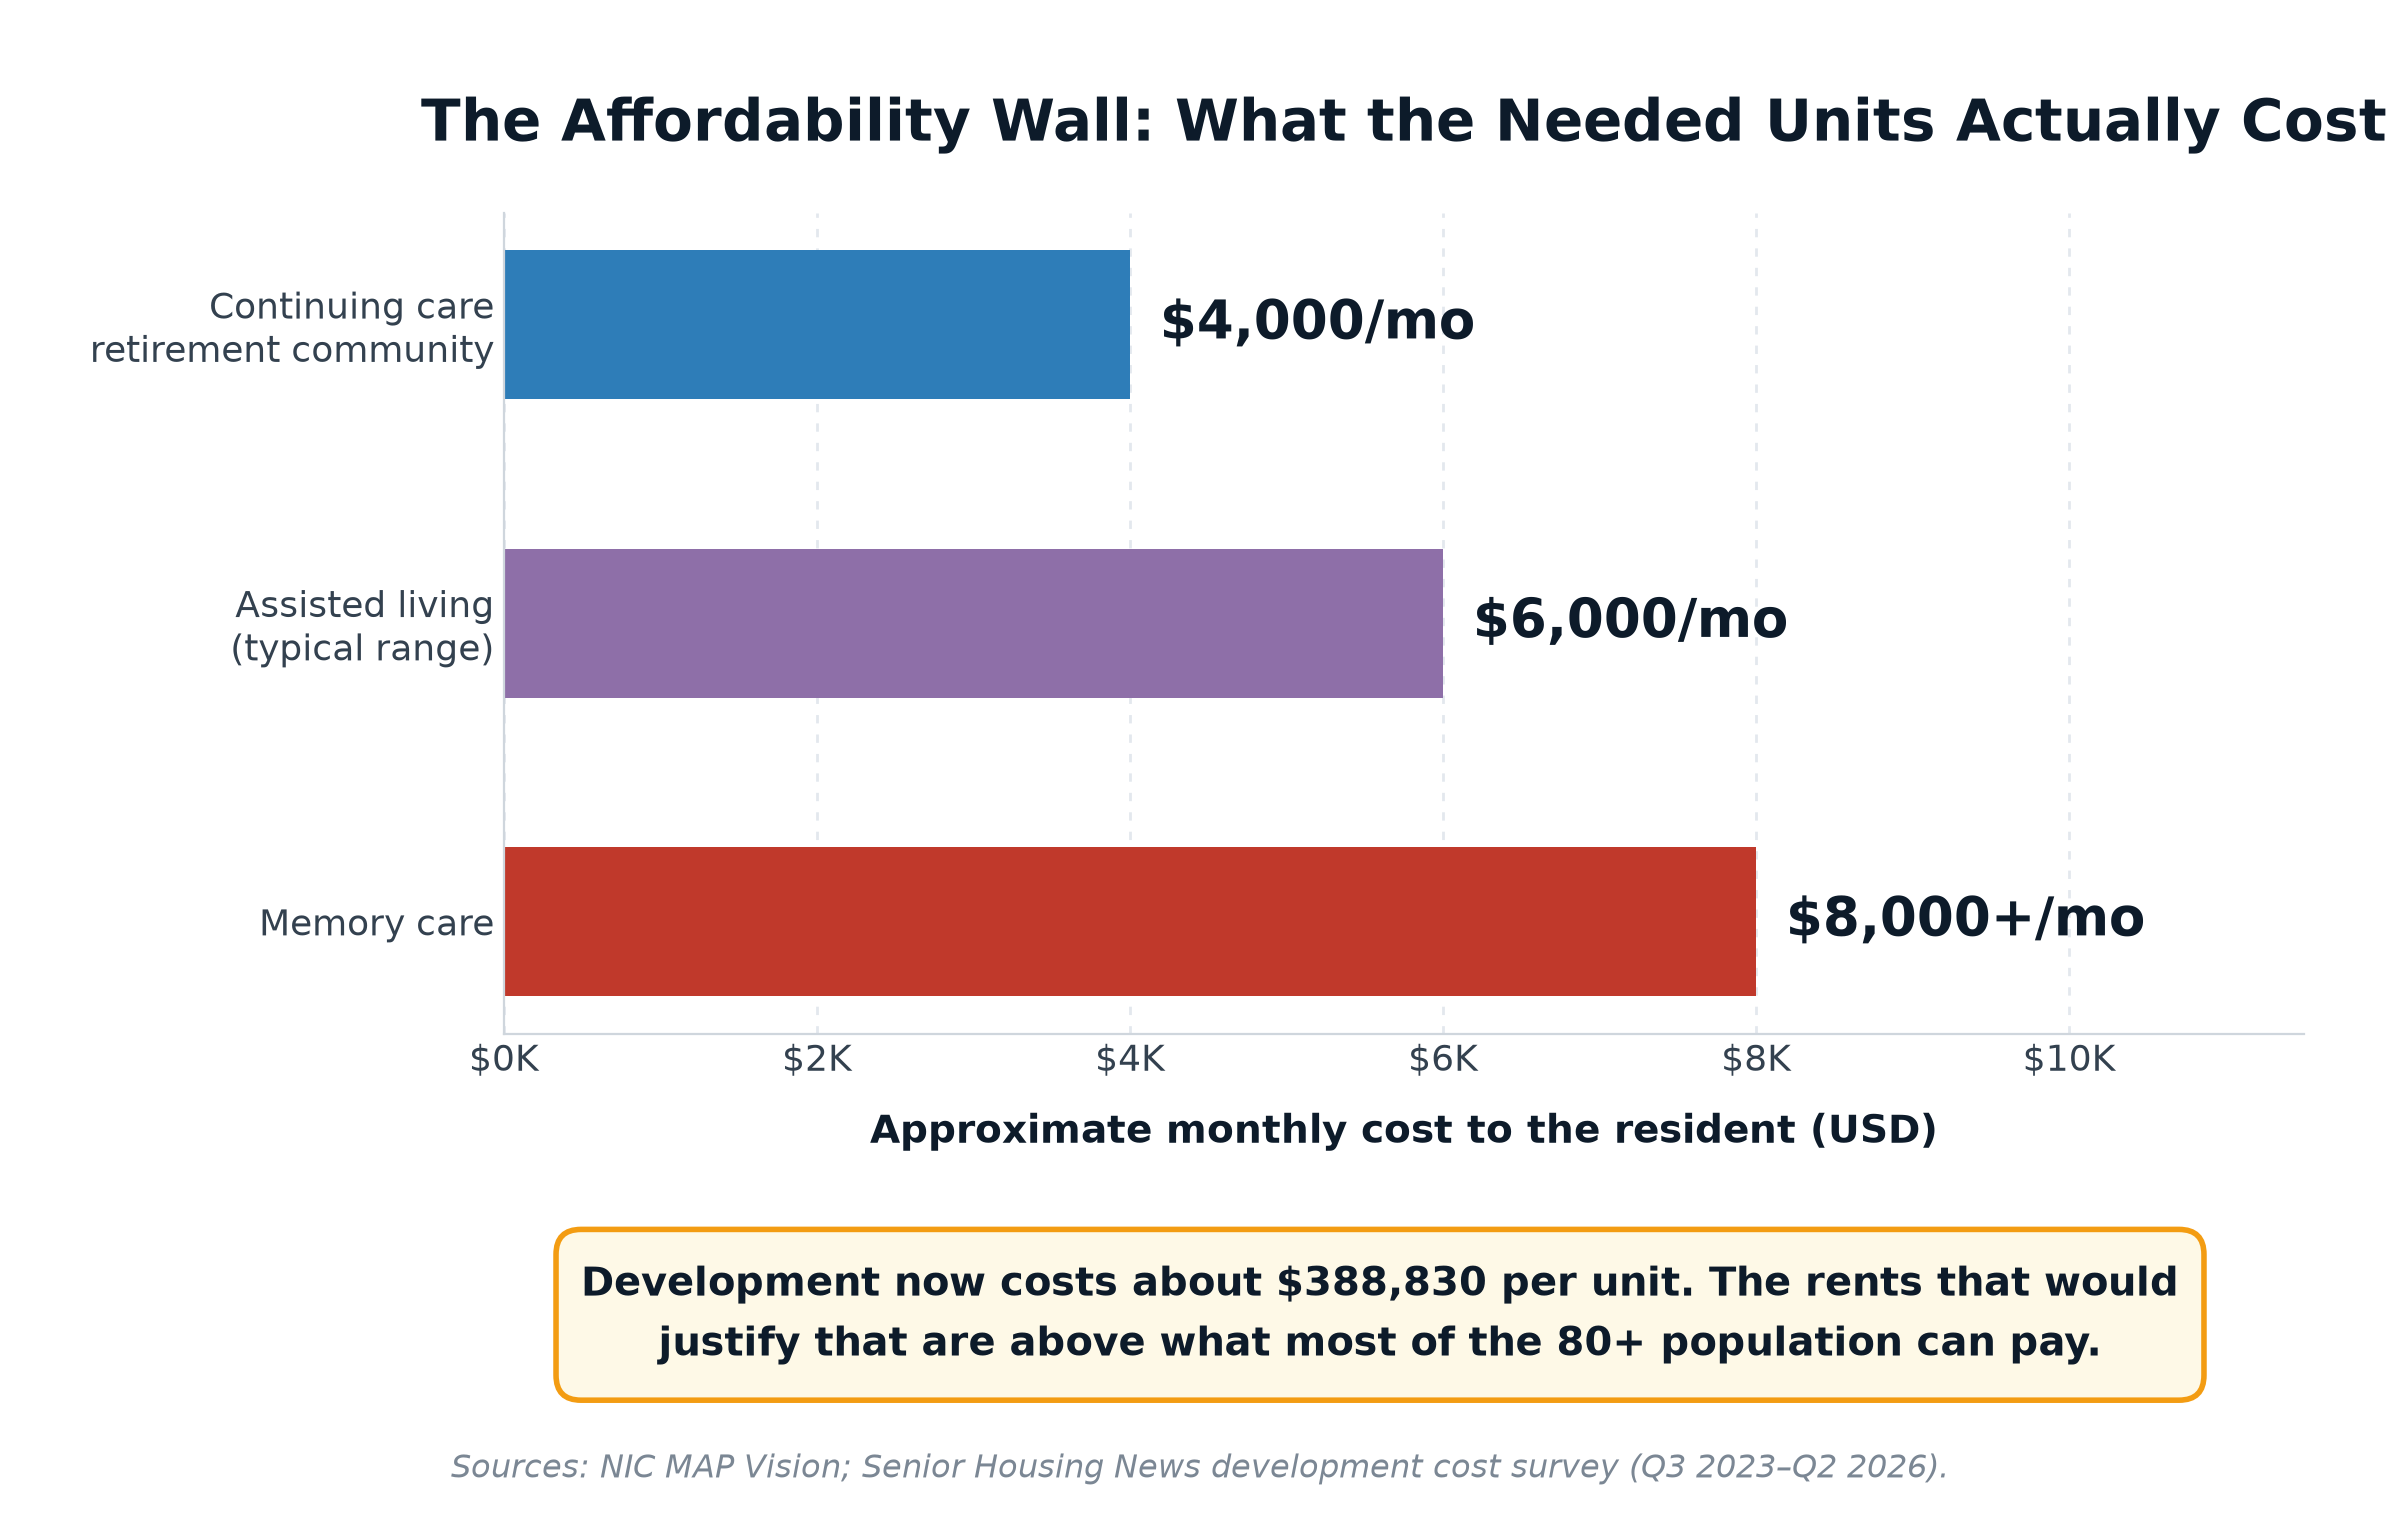
The arithmetic that stops construction. At roughly $388,830 per unit, a developer needs rents that service that capital cost plus operating expenses in a labour-intensive business with thin margins. Those rents land at or above the current price points. Meanwhile the population growing fastest is disproportionately middle-income — asset-rich in home equity, perhaps, but not cash-rich at $6,000 a month indefinitely. A developer looking at that spread is not being short-sighted by declining to build. They are reading it correctly. The units that would pencil serve a market segment that is already reasonably well supplied; the units that are needed do not pencil.
What the Data Does Not Say
Coverage is limited to primary markets. NIC MAP’s headline series track primary and secondary markets, not the entire country. Activity in smaller markets and rural areas is less well captured, and the national picture may differ at the margin.
The shortfall estimates are penetration-rate forecasts, not measurements. Both the 560,000 and 806,000 figures assume the 80-plus population uses congregate senior housing at something like historical rates. If home-based care, technology-assisted ageing in place, or multigenerational household formation absorb more of the cohort, required units fall — potentially a great deal. The affordability wall itself is a reason to expect exactly that substitution. A shortfall projection and a forecast of unmet need are not the same thing, and the industry’s own numbers embed an assumption about consumer behaviour that the price data arguably contradicts.
Cost figures are survey-based. The $388,830 per-unit figure comes from a development cost survey covering Q3 2023 through Q2 2026. It is a useful benchmark, not a census, and it aggregates widely varying project types and geographies.
Rising occupancy is not unambiguously good news. Occupancy climbing for nineteen straight quarters against flat supply reflects scarcity as much as success. For operators it is pricing power. For families searching for a placement, it is waiting lists.
What to Watch
Whether a middle-market product actually ships. The sector has discussed scaled-down, lower-service, lower-cost models for years. Nothing changes the arithmetic unless one reaches volume. Watch for construction starts at price points meaningfully below $4,000 a month.
Construction cost direction. Tariff policy and trades availability drive the per-unit figure more than interest rates now do. A sustained fall in either would move projects off the shelf faster than rate cuts alone.
The 29-month lag. Because of the build cycle, even a sharp recovery in starts during 2026 delivers no new beds until 2028 — by which point the 80-plus population will have grown by roughly another two million. The shortfall is locked in for at least two years regardless of what happens next.
Public-private structures. If the middle-market gap is not closable at market rates, the alternatives are subsidy, tax treatment, or public land contribution. Watch state-level pilots before federal action.
Conclusion. The claim that senior housing construction has hit a fourteen-year low while the population ages is true, and the two facts are not in tension once the price is included. Developers are not ignoring the demographics; they are looking at $388,830 per unit, a 29-month build, absent financing, and a customer base that largely cannot pay what those inputs require, and concluding that the project does not work. That is a rational response to the numbers in front of them. It is also a national supply shortage assembling itself in plain view, on a timeline where the earliest possible correction arrives in 2028.
References
AcadeResearch. (2026, July 15). The wire bottleneck: Why the AI buildout runs on electricians the U.S. has not trained. https://acaderesearch.com/wire-bottleneck-electricians-ai-data-center-shortage-2026/
National Investment Center for Seniors Housing & Care. (2026). Senior living occupancy grows amid construction slowdown, limiting options for older adults. https://www.nic.org/news-press/senior-living-occupancy-grows-amid-construction-slowdown-limiting-options-for-older-adults/
NIC MAP Vision. (2026a). Construction starts falling behind needed demand. https://www.nicmap.com/blog/construction-starts-falling-behind-needed-demand/
NIC MAP Vision. (2026b). Senior housing industry’s next challenge: A demand surge without the supply to match. https://www.nicmap.com/blog/senior-housing-industrys-next-challenge-a-demand-surge-without-the-supply-to-match/
NIC MAP Vision. (2026c). Senior housing: Five key trends to watch in 2026. https://www.nicmap.com/blog/senior-housing-five-key-trends-to-watch-in-2026/
NIC MAP Vision. (2026d). The impending age wave: Navigating the urgent need for senior housing. https://www.nicmap.com/blog/the-impending-age-wave-navigating-the-urgent-need-for-senior-housing/
PwC & Urban Land Institute. (2026). Emerging trends in real estate: Senior housing property type outlook. https://www.pwc.com/us/en/industries/financial-services/asset-wealth-management/real-estate/emerging-trends-in-real-estate-pwc-uli/property-type-outlook/senior-housing.html
Senior Housing News. (2026a, July 10). Development project costs rose to average of $388K between 2023 and 2026. https://seniorhousingnews.com/2026/07/10/
Senior Housing News. (2026b, May 18). Construction challenges linger, tempering hopes of senior living development uptick in 2026. https://seniorhousingnews.com/2026/05/18/
Senior Housing News. (2026c, June 4). Hopes of bigger development year in 2026 fading as senior living operators turn inward. https://seniorhousingnews.com/2026/06/04/