

Executive Summary
The cost of an unhappy workforce is usually described with one enormous number — Gallup currently puts global disengagement above $10 trillion a year. This report audits that figure, sets out what the peer-reviewed evidence actually supports, and identifies where the real cost hides.
Two US government and survey series now point in opposite directions. Gallup measures employee engagement at 31 percent, a level last seen in 2014. The Bureau of Labor Statistics’ quits rate has fallen to 1.97 percent for the first half of 2026 — identical to its 2015 average, and far below the 2.76 percent peak of the Great Resignation. Workers are as disengaged as they have been in a decade, and they have largely stopped leaving.
Key finding. That combination moves the cost of unhappiness down what this report calls the ladder of visibility. Turnover carries budget lines; a disengaged employee who stays carries none. The best-documented consequences — withheld ideas, unspoken warnings, effort no job description can compel — never appear on an income statement, and in one measurable case, occupational fraud, the silence itself compounds the loss.
A note on method: the popular numbers in this field are mostly produced by firms that sell the cure. This report separates those estimates from peer-reviewed research and government data, and labels which is which.
The Numbers Everyone Quotes
Gallup’s State of the Global Workplace estimates that low engagement costs the world economy more than $10 trillion a year — about 9 percent of global GDP. The figure is built by scaling survey-measured engagement gaps into assumed productivity differentials and multiplying across the global workforce. It is not an accounting measurement, the assumptions linking a survey answer to lost output are not independently verifiable, and Gallup sells engagement measurement and consulting — the same interest structure this publication flagged when auditing vendor headcount estimates in the cybersecurity industry. The number has also grown with each report cycle, from $8.8 trillion to more than $10 trillion in three years.
The other ubiquitous claim — that replacing an employee costs “one-half to two times annual salary” — traces to Gallup and SHRM materials. The most careful independent work is older and smaller: a 2012 Center for American Progress review of case studies by Boushey and Glynn found a median turnover cost of about 21 percent of annual salary for all positions except executives and physicians. Real, but a fraction of the range that circulates.
To be fair to Gallup: its underlying survey is the largest continuous measurement of workplace attitudes in existence, its US sample in 2024 alone was 79,087 workers with a margin of error of half a point, and — as shown below — the direction of its findings is corroborated by peer-reviewed research it does not control. The problem is not the survey. The problem is treating an advocacy estimate as an accounting fact.
What Survives Scrutiny
The stock market systematically underprices employee satisfaction. The most rigorous evidence in the field is Alex Edmans’ asset-pricing work: a portfolio of Fortune’s “100 Best Companies to Work For” earned a four-factor alpha of roughly 3.5 percent a year over 1984–2009 — returns that persisted for decades after the lists were public, meaning the market kept failing to price the information in. The international follow-up adds a mechanism: the effect appears in flexible labor markets such as the US and UK, and disappears in rigid ones such as Germany, consistent with satisfaction working through recruitment, retention and motivation.
Workplace stress has a measurable health bill. Goh, Pfeffer and Zenios, in Management Science, modelled ten workplace stressors and attributed roughly 120,000 US deaths a year and 5–8 percent of national healthcare costs to them — mortality comparable to the fourth or fifth leading causes of death. The honest caveat: it is a model, and its stressors include unemployment and lack of insurance, not only the experience of a bad job.
And fraud data shows what silence costs in dollars — covered below, because it belongs to the mechanism this report is actually about.
The Scissors: Unhappy, and Staying
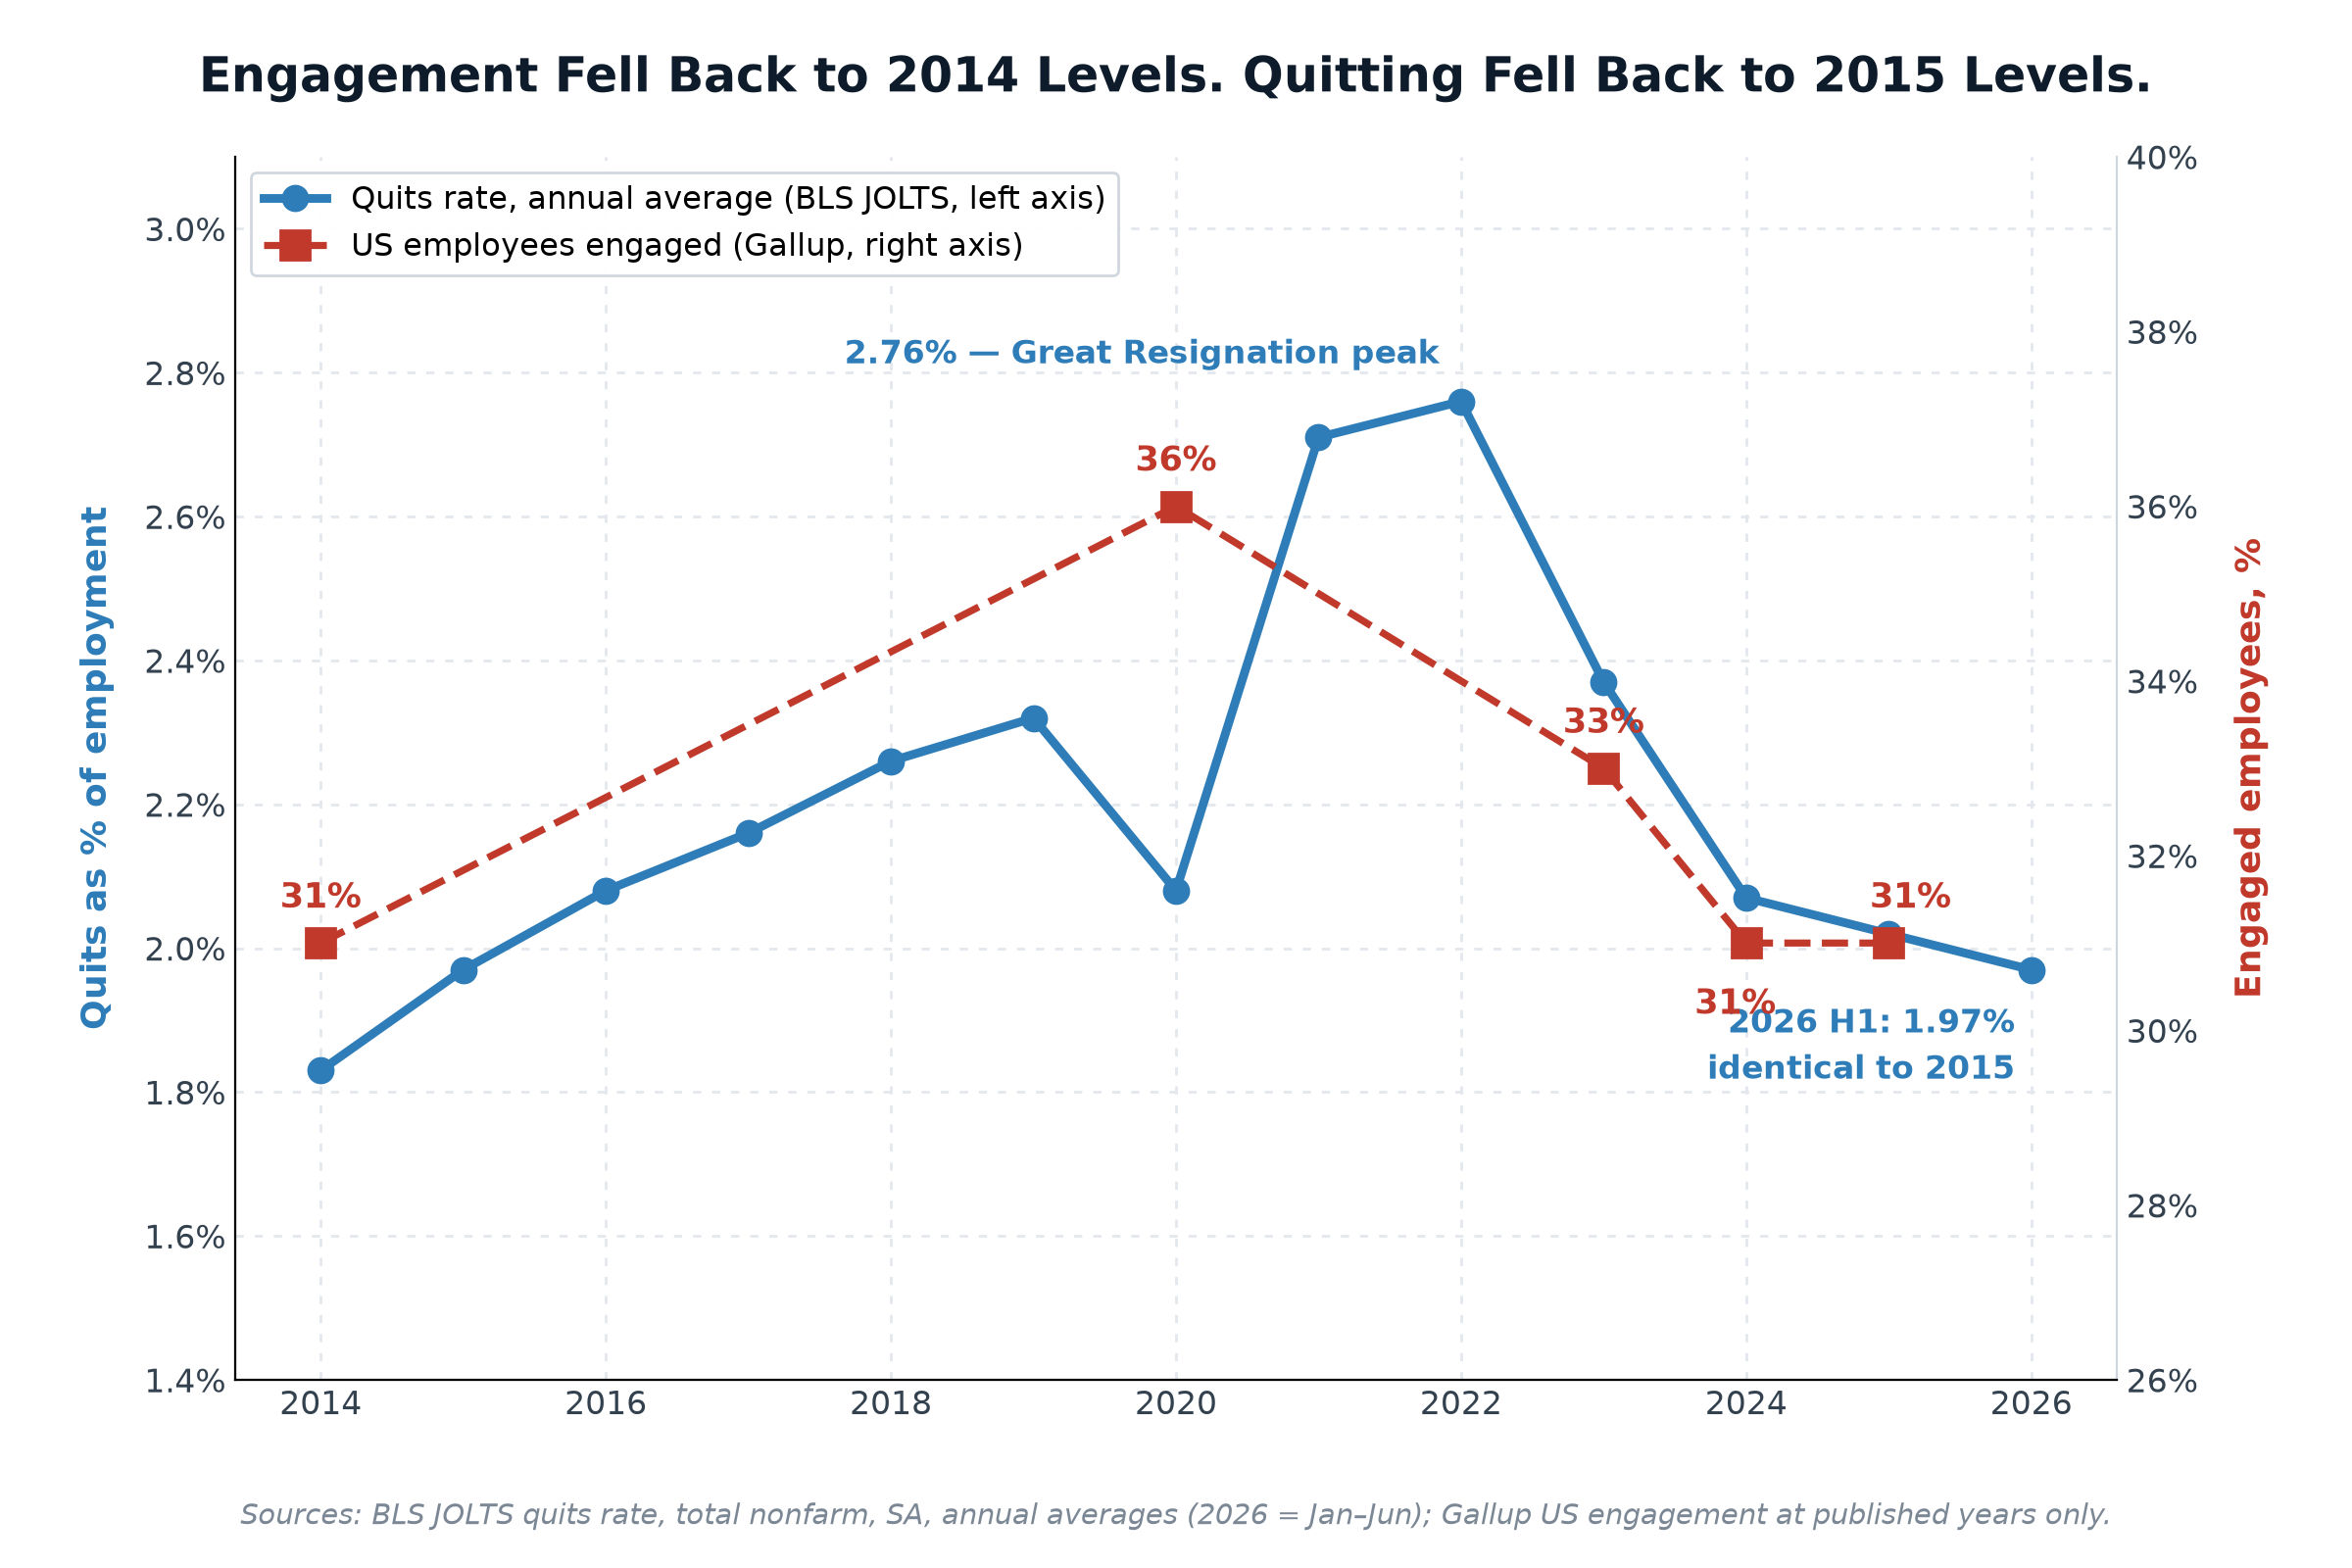
During the Great Resignation, unhappiness had an exit. Quits peaked at a 2.76 percent annual average in 2022 — roughly 4 million resignations a month at the high point — and the cost of dissatisfaction showed up where accountants could see it: recruiting budgets, signing bonuses, backfill overtime.
That exit has closed. The quits rate averaged 1.97 percent in the first half of 2026 — to the basis point, the same as 2015 — and monthly quits are running near 3.2 million. Meanwhile Gallup’s US engagement measure sits at 31 percent, matching 2014, down from its 36 percent peak in 2020, with 17 percent of employees actively disengaged. Each engagement point represents roughly 1.6 million US workers.
Read together — with the caution that they are different instruments measuring different things — the two series describe a workforce as dissatisfied as it has been in a decade, in a labor market that no longer offers the traditional response. The unhappy used to leave, and leaving was at least countable. Now they stay. Whatever dissatisfaction costs an employer, it has migrated from the budget lines that measure departure to the places nothing measures at all.
The Ladder of Visibility
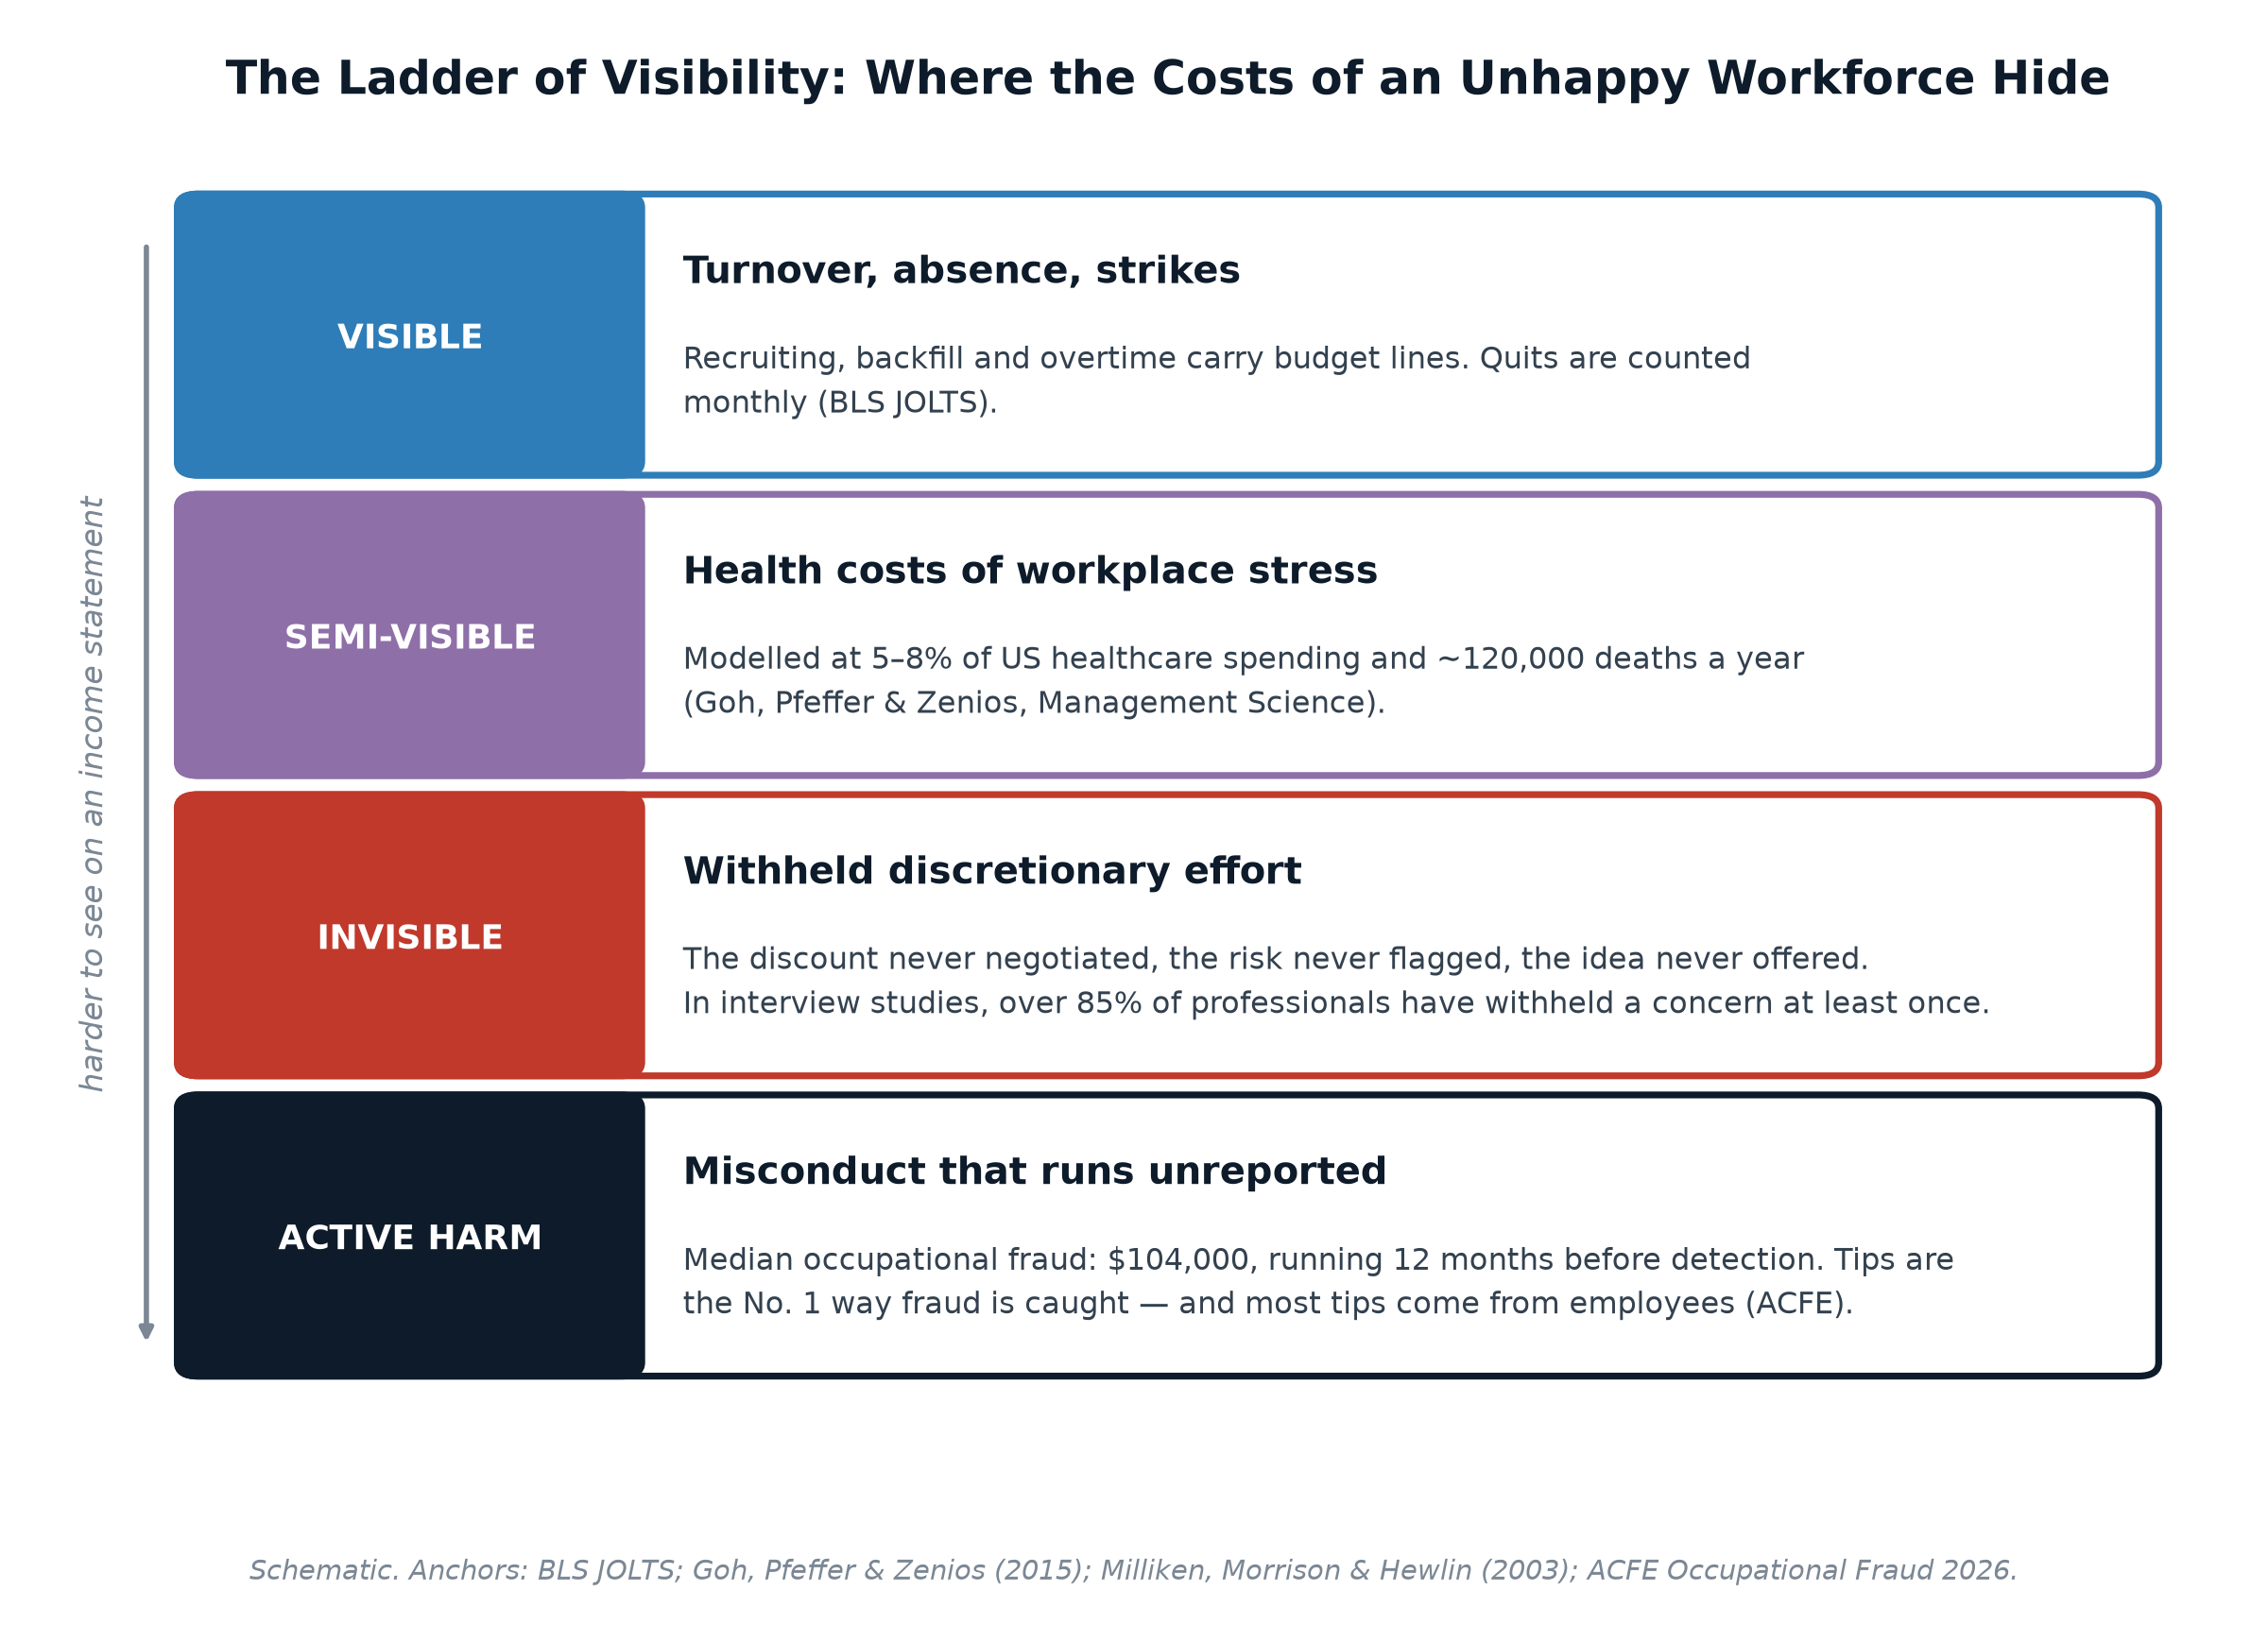
The costs of an unhappy workforce are not one thing. They sit on a ladder, and each rung down is harder to see on an income statement. Turnover and absence are visible — they carry budget lines. The health consequences of workplace stress are semi-visible — they surface in insurance premiums and claims data, years later and pooled with everything else. The two bottom rungs are where the real subject of this report lives.
The Invisible Rung: Effort No One Can Demand
Consider a procurement manager reviewing a vendor renewal quoted 8 percent high. Engaged, she pushes back, escalates, plays two suppliers against each other, and saves an amount that will never be attributed to her. Disengaged, she approves it. The contract is signed either way. Nothing is flagged, nothing is late, no metric moves. The discount that was never negotiated does not exist in any system — there is no counterfactual line item for it, even in principle. (This scenario is an illustration of a documented class of behavior, not a quantified finding — no study measures negotiation effort against morale directly.)
What the research does document is the class. Organizational scholars call it employee silence: “the withholding of ideas, suggestions, or concerns about people, products, or processes that might have been communicated to someone with the authority to act.” In the foundational interview research of Milliken, Morrison and Hewlin, more than 85 percent of managers and professionals acknowledged having withheld a concern from their employer at least once; Detert and Edmondson found roughly half of employees at a single well-run technology company felt unable to raise known problems. And in Morrison’s review of the literature, the leading driver of silence is not fear. It is lack of motivation — the quiet conclusion that speaking up is not worth the effort because nothing will change.
That is the causal link this report’s title describes. Unhappiness does not only reduce how much work gets done. It switches off the category of contribution that cannot be specified in a job description, monitored by a dashboard, or demanded in a performance review: the hard negotiation, the flagged risk, the unsolicited idea, the correction offered to a colleague. Every item in that category shares two properties — its benefit goes entirely to the employer, and its absence is undetectable.
The Bottom Rung, Where Silence Gets a Price
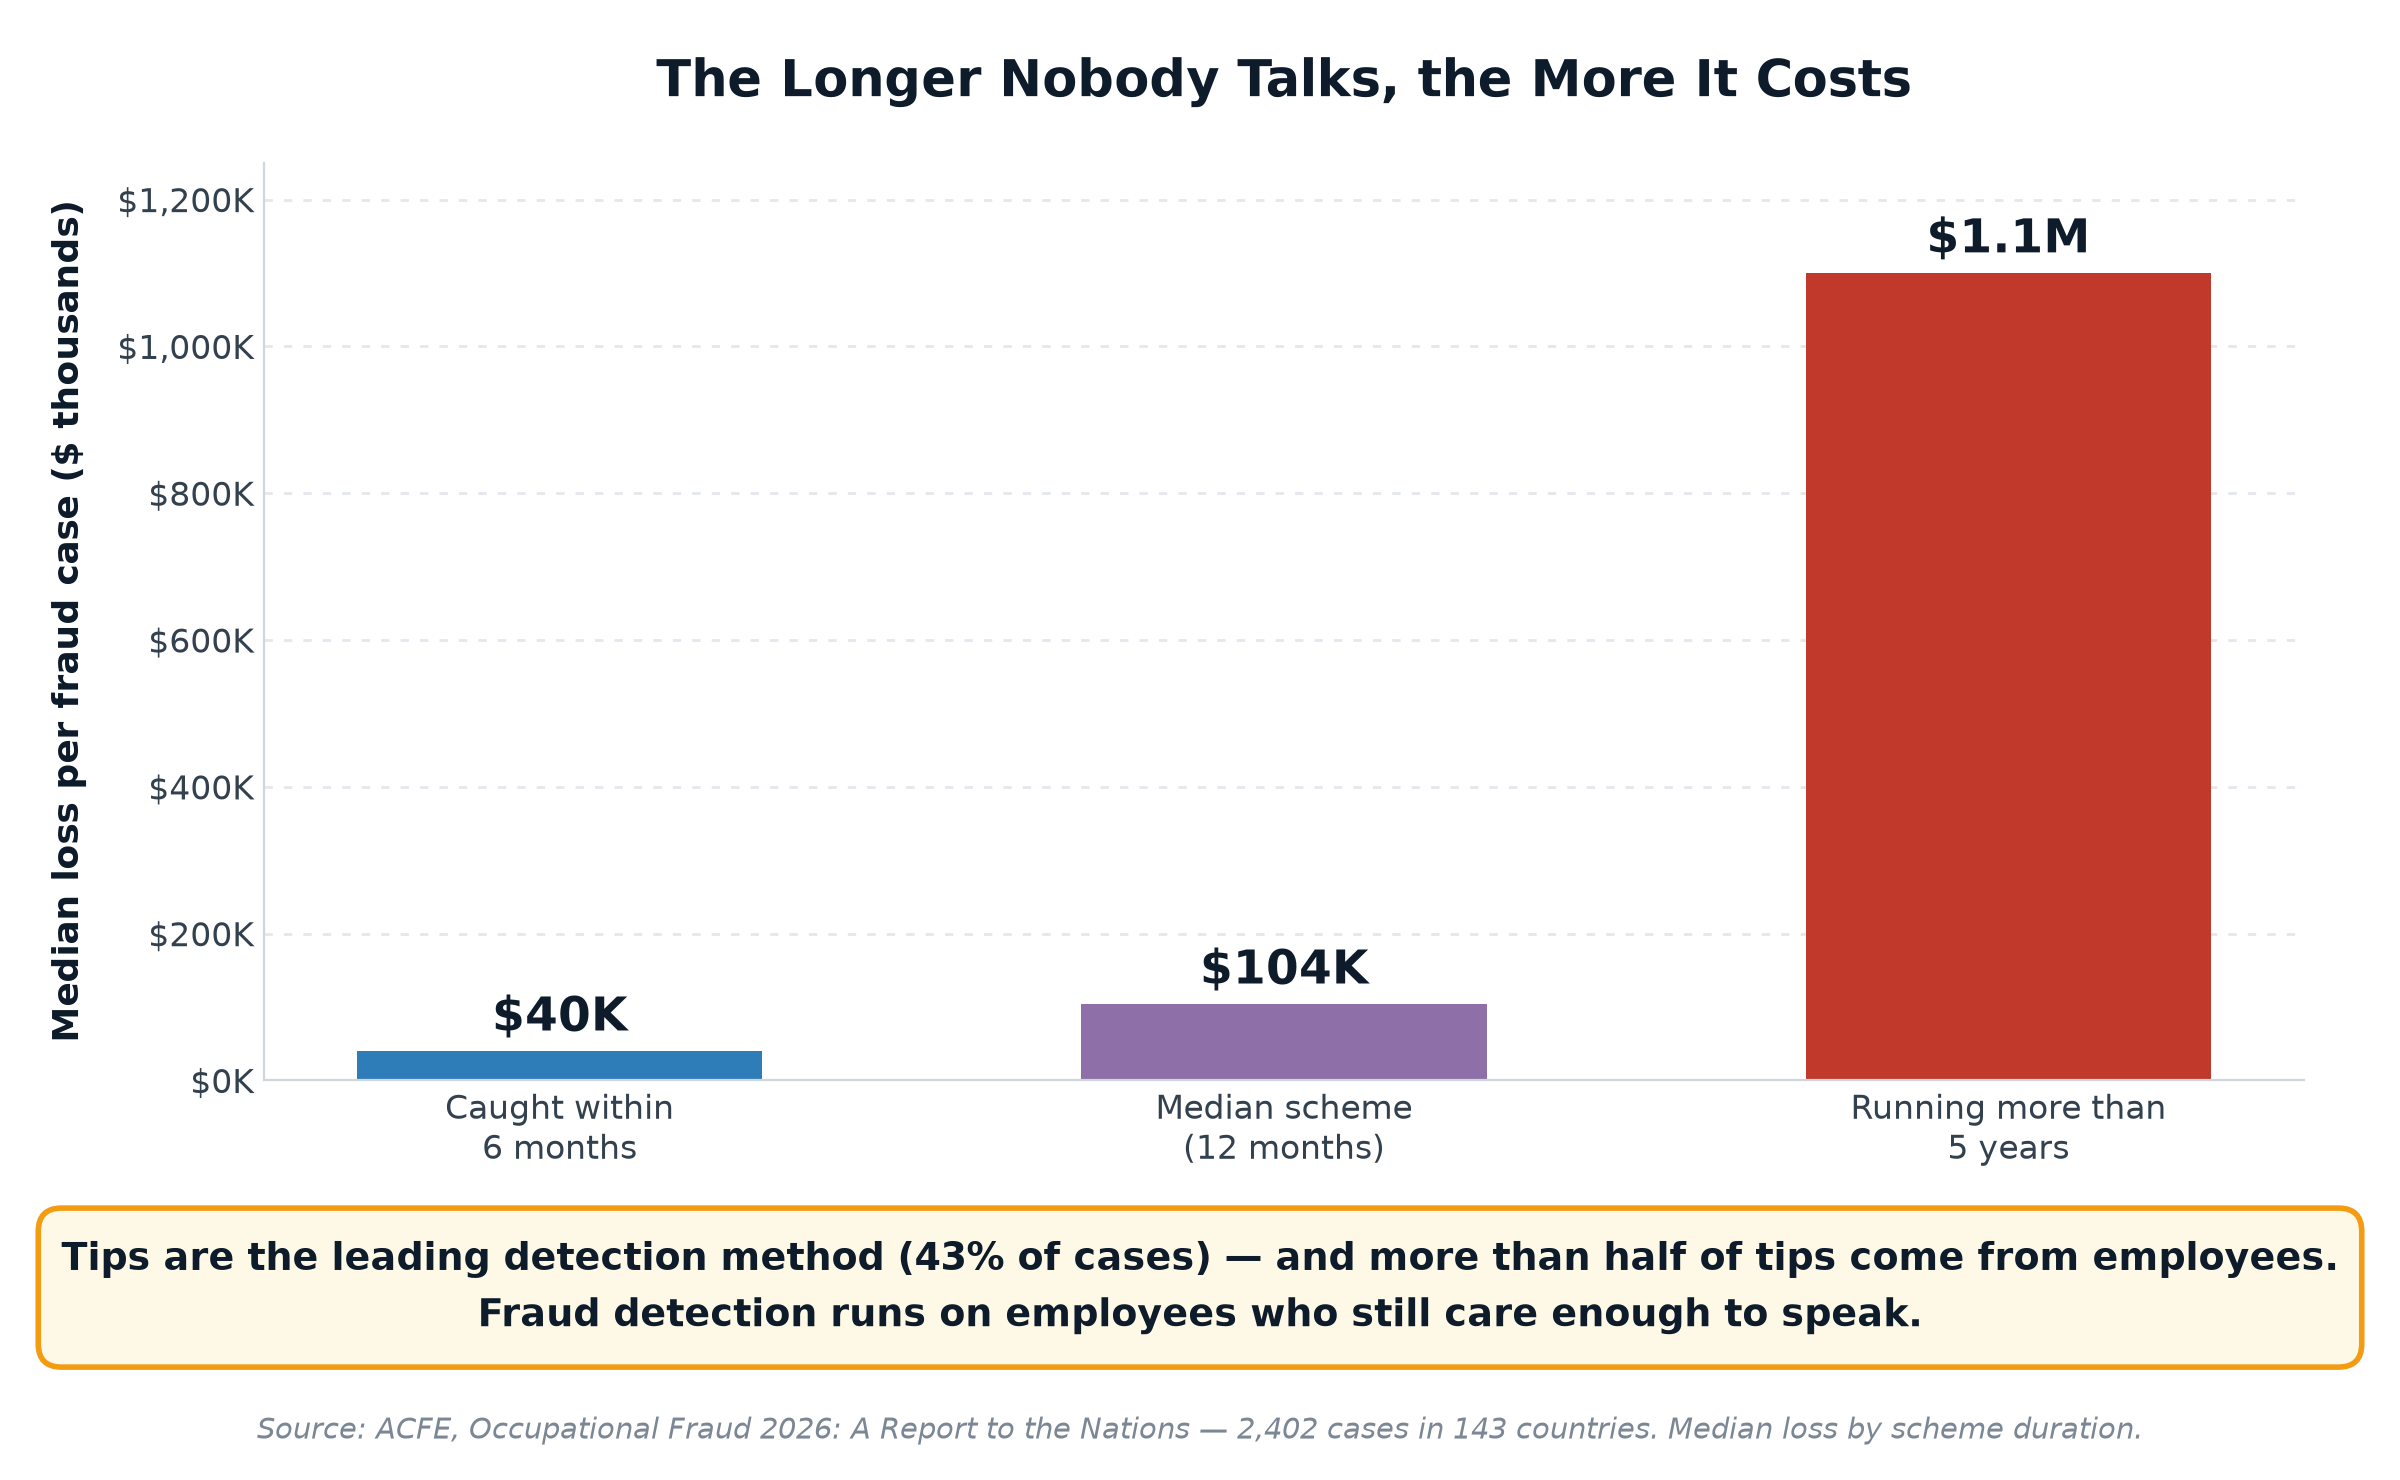
In one domain, the cost of employees who stop speaking is quantified — by case data rather than survey extrapolation. The Association of Certified Fraud Examiners’ 2026 study of 2,402 occupational fraud cases across 143 countries found a median loss of $104,000 and an average above $1.4 million, with the typical scheme running about twelve months before discovery. Duration is nearly everything: schemes caught within six months show a median loss of $40,000; schemes that survive five years, $1.1 million.
And what shortens duration? People. Tips are the leading detection method, accounting for 43 percent of cases — and more than half of tips come from employees. Fraud detection, in practice, is not primarily an audit function. It runs on employees who still care enough to say something. An organization whose workforce has concluded that speaking up is not worth the effort has not just lost discretionary effort; it has quietly disabled its most effective control. The same withdrawal that leaves a discount un-negotiated leaves a fraud running.
The Lever: What Management Actually Controls
If withheld conviction is the cost, the evidence on where conviction comes from is unusually consistent — and it is not where mission statements are written.
The definitive study is Gartenberg, Prat and Serafeim in Organization Science, built on roughly 500,000 employee survey responses. Firms whose workers merely report a strong sense of purpose show no performance advantage. Firms whose workers report purpose and clarity about the path to it show systematically higher future stock and accounting performance — and the effect is carried entirely by middle managers and professional staff, not by executives and not by hourly workers. Belief in the mission predicts performance only when it lives in the layer that translates strategy into daily decisions. A statement nobody believes measures zero; Enron’s stated values were respect, integrity, communication and excellence.
Gallup’s team-level research points at the same layer from a different dataset: across 2.7 million workers on roughly 100,000 teams, the manager accounts for about 70 percent of the variance in team engagement. A consistency note this publication owes its readers: that is a Gallup finding, from the vendor whose headline number this report just audited. It is cited here because it triangulates with the peer-reviewed Gartenberg result rather than standing alone — two independent datasets, one commercial and one academic, both locating the effect at the manager and middle layer.
For executives the implication is uncomfortable but specific. Motivating teams and winning genuine support for the company’s direction is not a soft-skills garnish; on this evidence it is the input that decides whether the invisible rung of the ladder works for you or against you. And it cannot be announced into existence. Purpose without believed clarity measured zero. The transmission mechanism is the everyday manager, one level up from the work — which is also, per Gallup’s US data, the population whose own engagement has been falling.
What This Analysis Does Not Establish
Causality runs both ways. Edmans’ portfolios and Gartenberg’s purpose-clarity firms could partly reflect that successful companies are easier to be happy in. Both studies control for observables and predict future performance, which weakens but does not eliminate the objection.
The scissors is a correlation of two different instruments. JOLTS counts actual resignations; Gallup’s engagement is a survey construct measured against its own definition. They are plotted together to show direction, not to imply one causes the other — and low quits also reflect a cooler hiring market, not only trapped dissatisfaction.
The silence figures come from small interview studies. The 85 percent finding is foundational but qualitative, drawn from dozens of interviews rather than thousands of respondents. It establishes the behavior exists and is common; it does not measure its dollar cost.
The procurement example is an illustration. No study quantifies negotiation effort as a function of morale. It is used here to make a documented class of behavior concrete, and is labelled accordingly where it appears.
The health estimate is a model. Goh, Pfeffer and Zenios’ stressors include unemployment and lack of insurance; their figure should not be read as the cost of unhappiness at work alone.
What to Watch
Whether the quits rate breaks below its 2015 floor. Sustained readings under 1.9 percent would put the US in territory seen only in the post-2008 recovery — and would mean the scissors is still opening.
Gallup’s next US engagement reading. A fourth consecutive year at or below 31 percent would make the post-2020 slide look structural rather than cyclical — worth watching precisely because the series is the field’s common reference, whatever one thinks of its dollar extrapolations.
Human-capital disclosure. The deepest problem in this field is that firms disclose almost nothing — no turnover rates, no engagement data, no internal-mobility figures. As with AI spending, the honest answer to “what does it cost” is that the data to answer it is not published. Any movement toward standardized workforce disclosure would do more for this question than another decade of vendor estimates.
Conclusion. The famous numbers are advocacy; the real evidence is narrower and more interesting. Satisfied workforces predict abnormal stock returns that markets have failed to price for decades. Workplace stress carries a modelled six-figure death toll. And the best-documented cost of unhappiness is not laziness but withdrawal — of ideas, warnings and effort that no contract can compel, in a labor market where the dissatisfied increasingly stay put. The one place silence has a price tag, fraud, suggests the invisible rungs are expensive. The one lever the evidence validates is believed purpose, transmitted through ordinary managers — conviction that must be earned, because announcing it measures zero.
Sources
US Bureau of Labor Statistics. Job Openings and Labor Turnover Survey, quits rate, total nonfarm, seasonally adjusted, series JTS000000000000000QUR, retrieved via the BLS public API, August 2026. https://www.bls.gov/jlt/
Gallup. U.S. Employee Engagement Sinks to 10-Year Low, January 2025; State of the Global Workplace, 2025 and 2026 editions. https://www.gallup.com/workplace/654911/employee-engagement-sinks-year-low.aspx
Edmans, A. Does the Stock Market Fully Value Intangibles? Employee Satisfaction and Equity Prices. Journal of Financial Economics, 2011. https://papers.ssrn.com/sol3/papers.cfm?abstract_id=985735; Edmans, Li & Zhang, Employee Satisfaction, Labor Market Flexibility, and Stock Returns Around the World, NBER Working Paper 20300. https://www.nber.org/system/files/working_papers/w20300/w20300.pdf
Goh, J., Pfeffer, J. & Zenios, S. The Relationship Between Workplace Stressors and Mortality and Health Costs in the United States. Management Science, 2015. https://pubsonline.informs.org/doi/10.1287/mnsc.2014.2115
Milliken, F., Morrison, E. & Hewlin, P. An Exploratory Study of Employee Silence, Journal of Management Studies, 2003; Morrison, E. & Milliken, F. Organizational Silence, Academy of Management Review, 2000; Detert, J. & Edmondson, A. Implicit Voice Theories, Academy of Management Journal, 2011.
Association of Certified Fraud Examiners. Occupational Fraud 2026: A Report to the Nations. https://www.acfe.com/report-to-the-nations
Gartenberg, C., Prat, A. & Serafeim, G. Corporate Purpose and Financial Performance. Organization Science, 2019. https://pubsonline.informs.org/doi/10.1287/orsc.2018.1230
Boushey, H. & Glynn, S.J. There Are Significant Business Costs to Replacing Employees. Center for American Progress, 2012. https://www.americanprogress.org/article/there-are-significant-business-costs-to-replacing-employees/
Gallup. State of the American Manager, 2015, for the manager share of team-engagement variance.