
The 2026 spring housing market is sending mixed signals. Mortgage rates have fallen to their lowest levels in three spring seasons, inventory is at a post-2020 high, and yet existing-home sales just posted the slowest March since 2009. This analysis breaks down the data, presents regional differences, and assesses whether buyers should wait or move now.
Section 1: Market Overview
The U.S. housing market in spring 2026 is defined by three converging dynamics: improving affordability, rising inventory, and softening transaction volume. Each has accelerated since the start of the year.
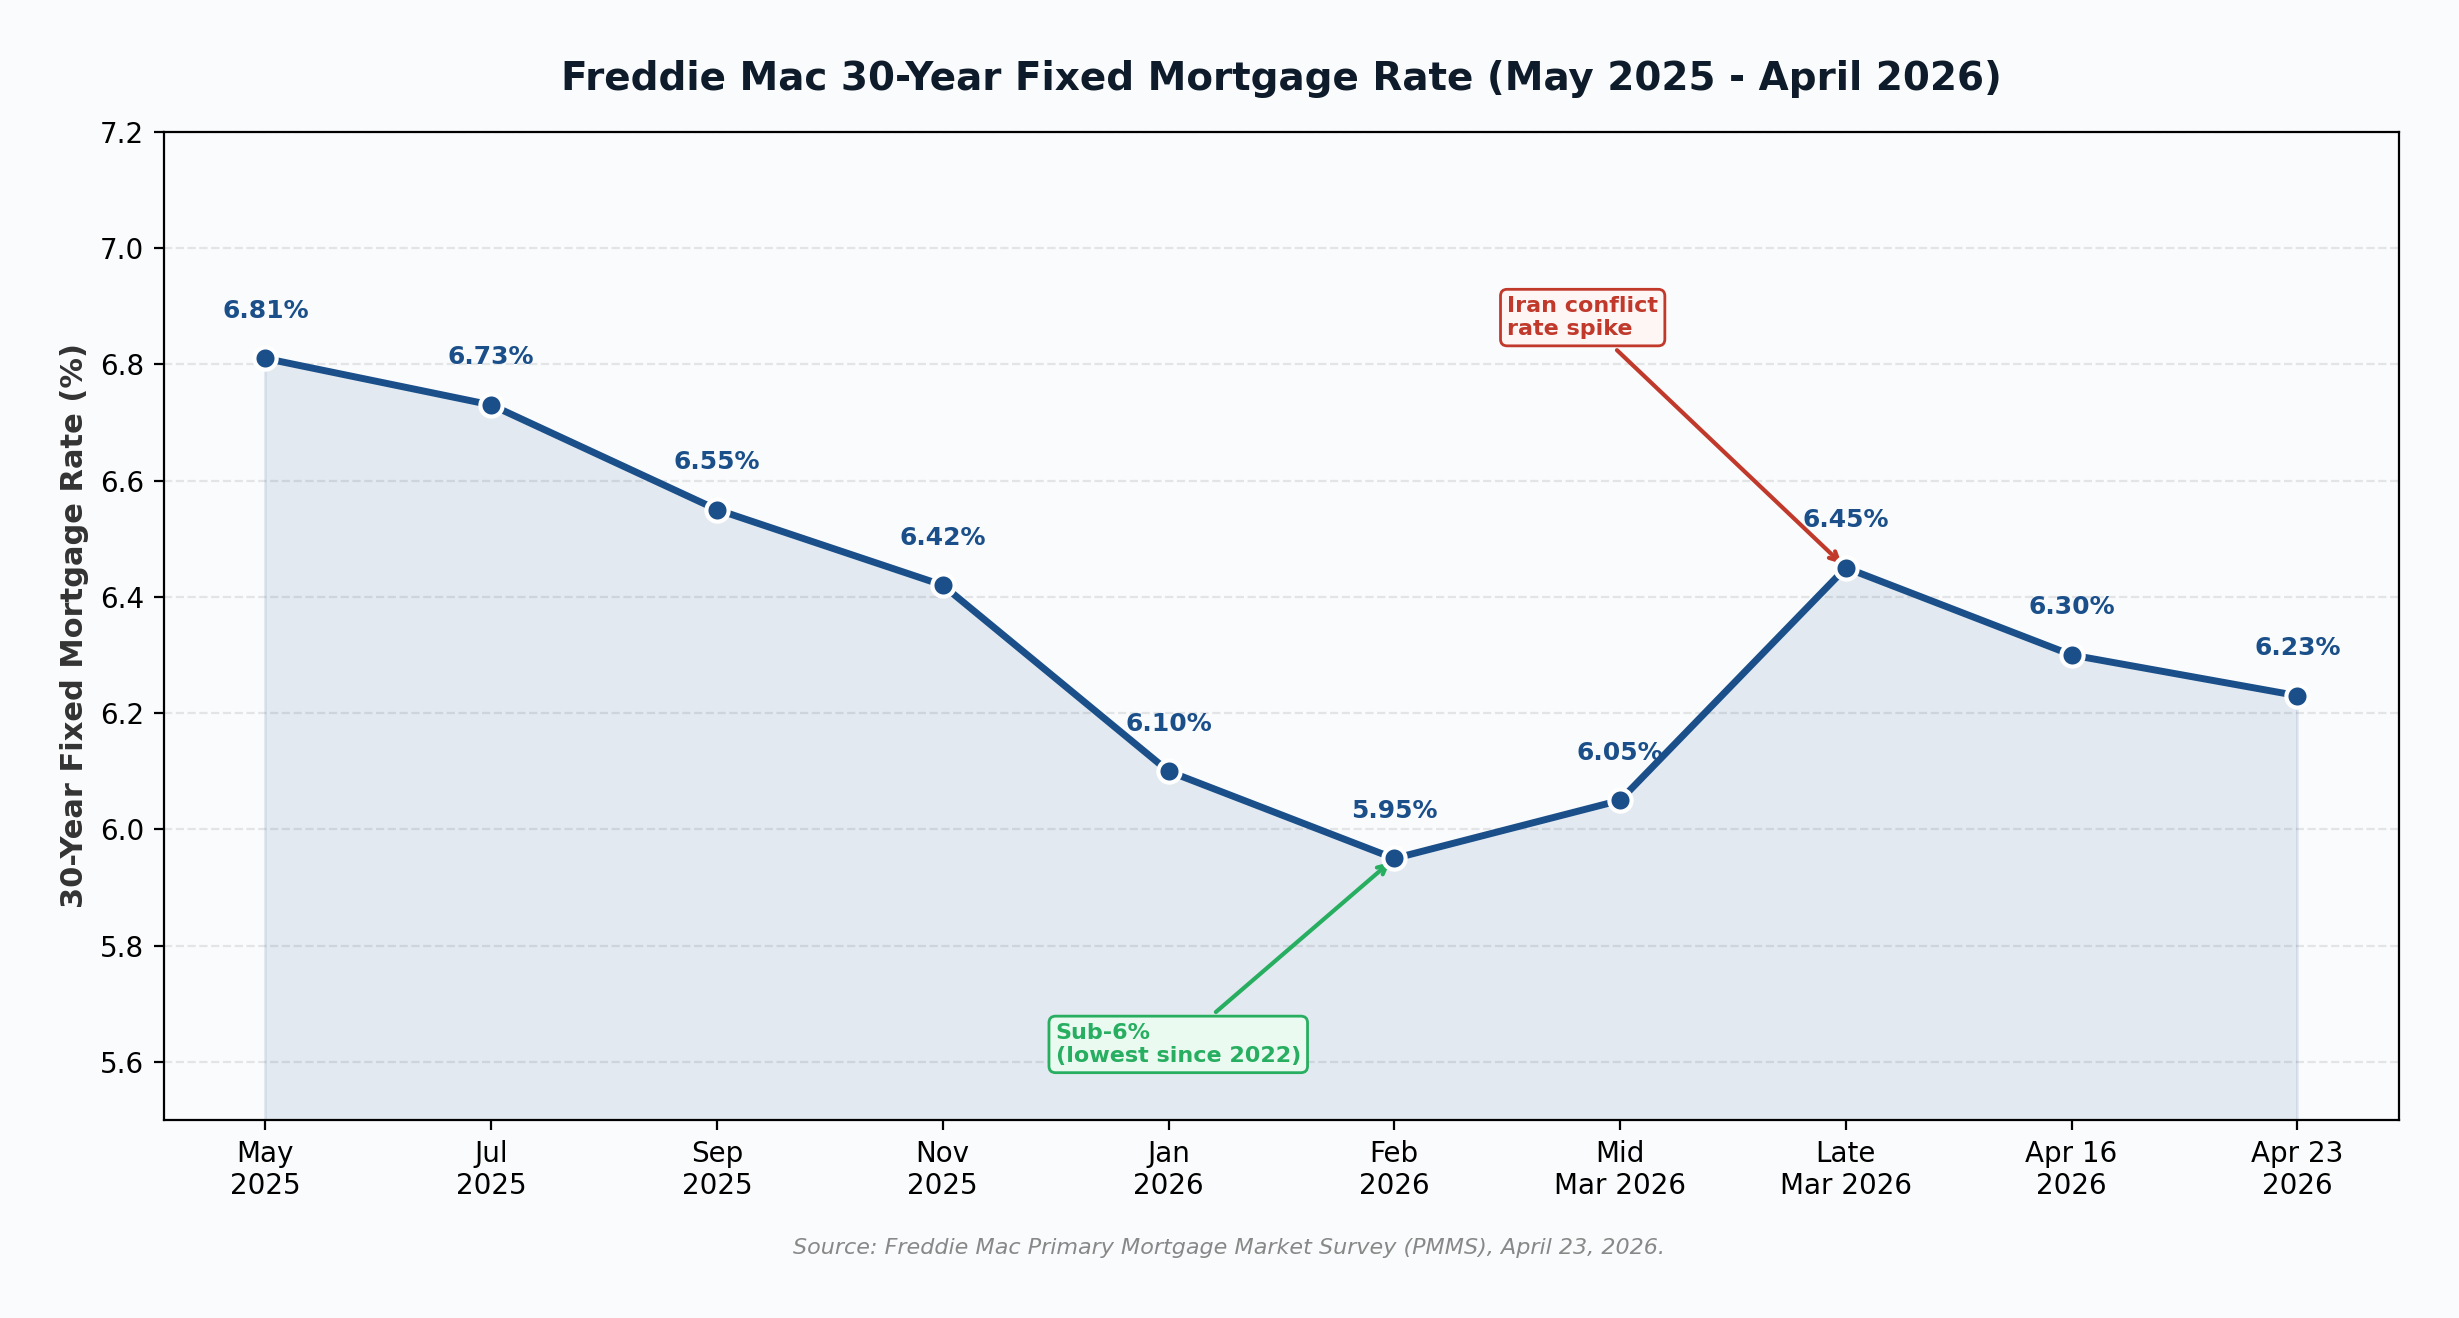
Mortgage rates. According to Freddie Mac’s Primary Mortgage Market Survey, the 30-year fixed-rate mortgage averaged 6.23% as of April 23, 2026, down from 6.30% the prior week and well below the 6.81% recorded one year earlier (Freddie Mac, 2026). Sam Khater, Freddie Mac’s Chief Economist, noted that “rates currently stand at their lowest level in the last three spring homebuying seasons” (Stock Titan, 2026). Rates briefly fell below 6% in late February, the first sub-6% reading since 2022, before climbing to 6.45% in late March amid bond market volatility tied to the Iran conflict, then easing back into the low 6% range in April (Realtor.com, 2026).
Inventory. Housing supply continues to expand. NAR reported total inventory of 1.36 million existing-home listings at the end of March 2026, up 2.3% year over year, equivalent to 4.1 months of supply at the current sales pace, the highest March reading since 2020 (NAR, 2026a). Realtor.com data shows active listings climbed 8.1% year over year to 964,477, the 29th consecutive month of YoY inventory gains, though nationwide inventory remains 13.8% below the 2017 to 2019 average (Realtor.com, 2026).
Prices. NAR’s median existing-home sales price hit $408,800 in March 2026, up 1.4% year over year, marking the 33rd consecutive month of annual price increases and a new all-time March record (NAR, 2026a). Realtor.com’s median list price tells a different story, falling 2.2% year over year to $415,450 in March, the fifth straight month of annual list price declines (Realtor.com, 2026). The divergence reflects what economists call “mix shift”: more lower-priced homes coming to market is pulling list prices down, even as the homes that actually sell continue to skew higher-priced.
Section 2: Home Value Map (Complete State-Level Breakdown)
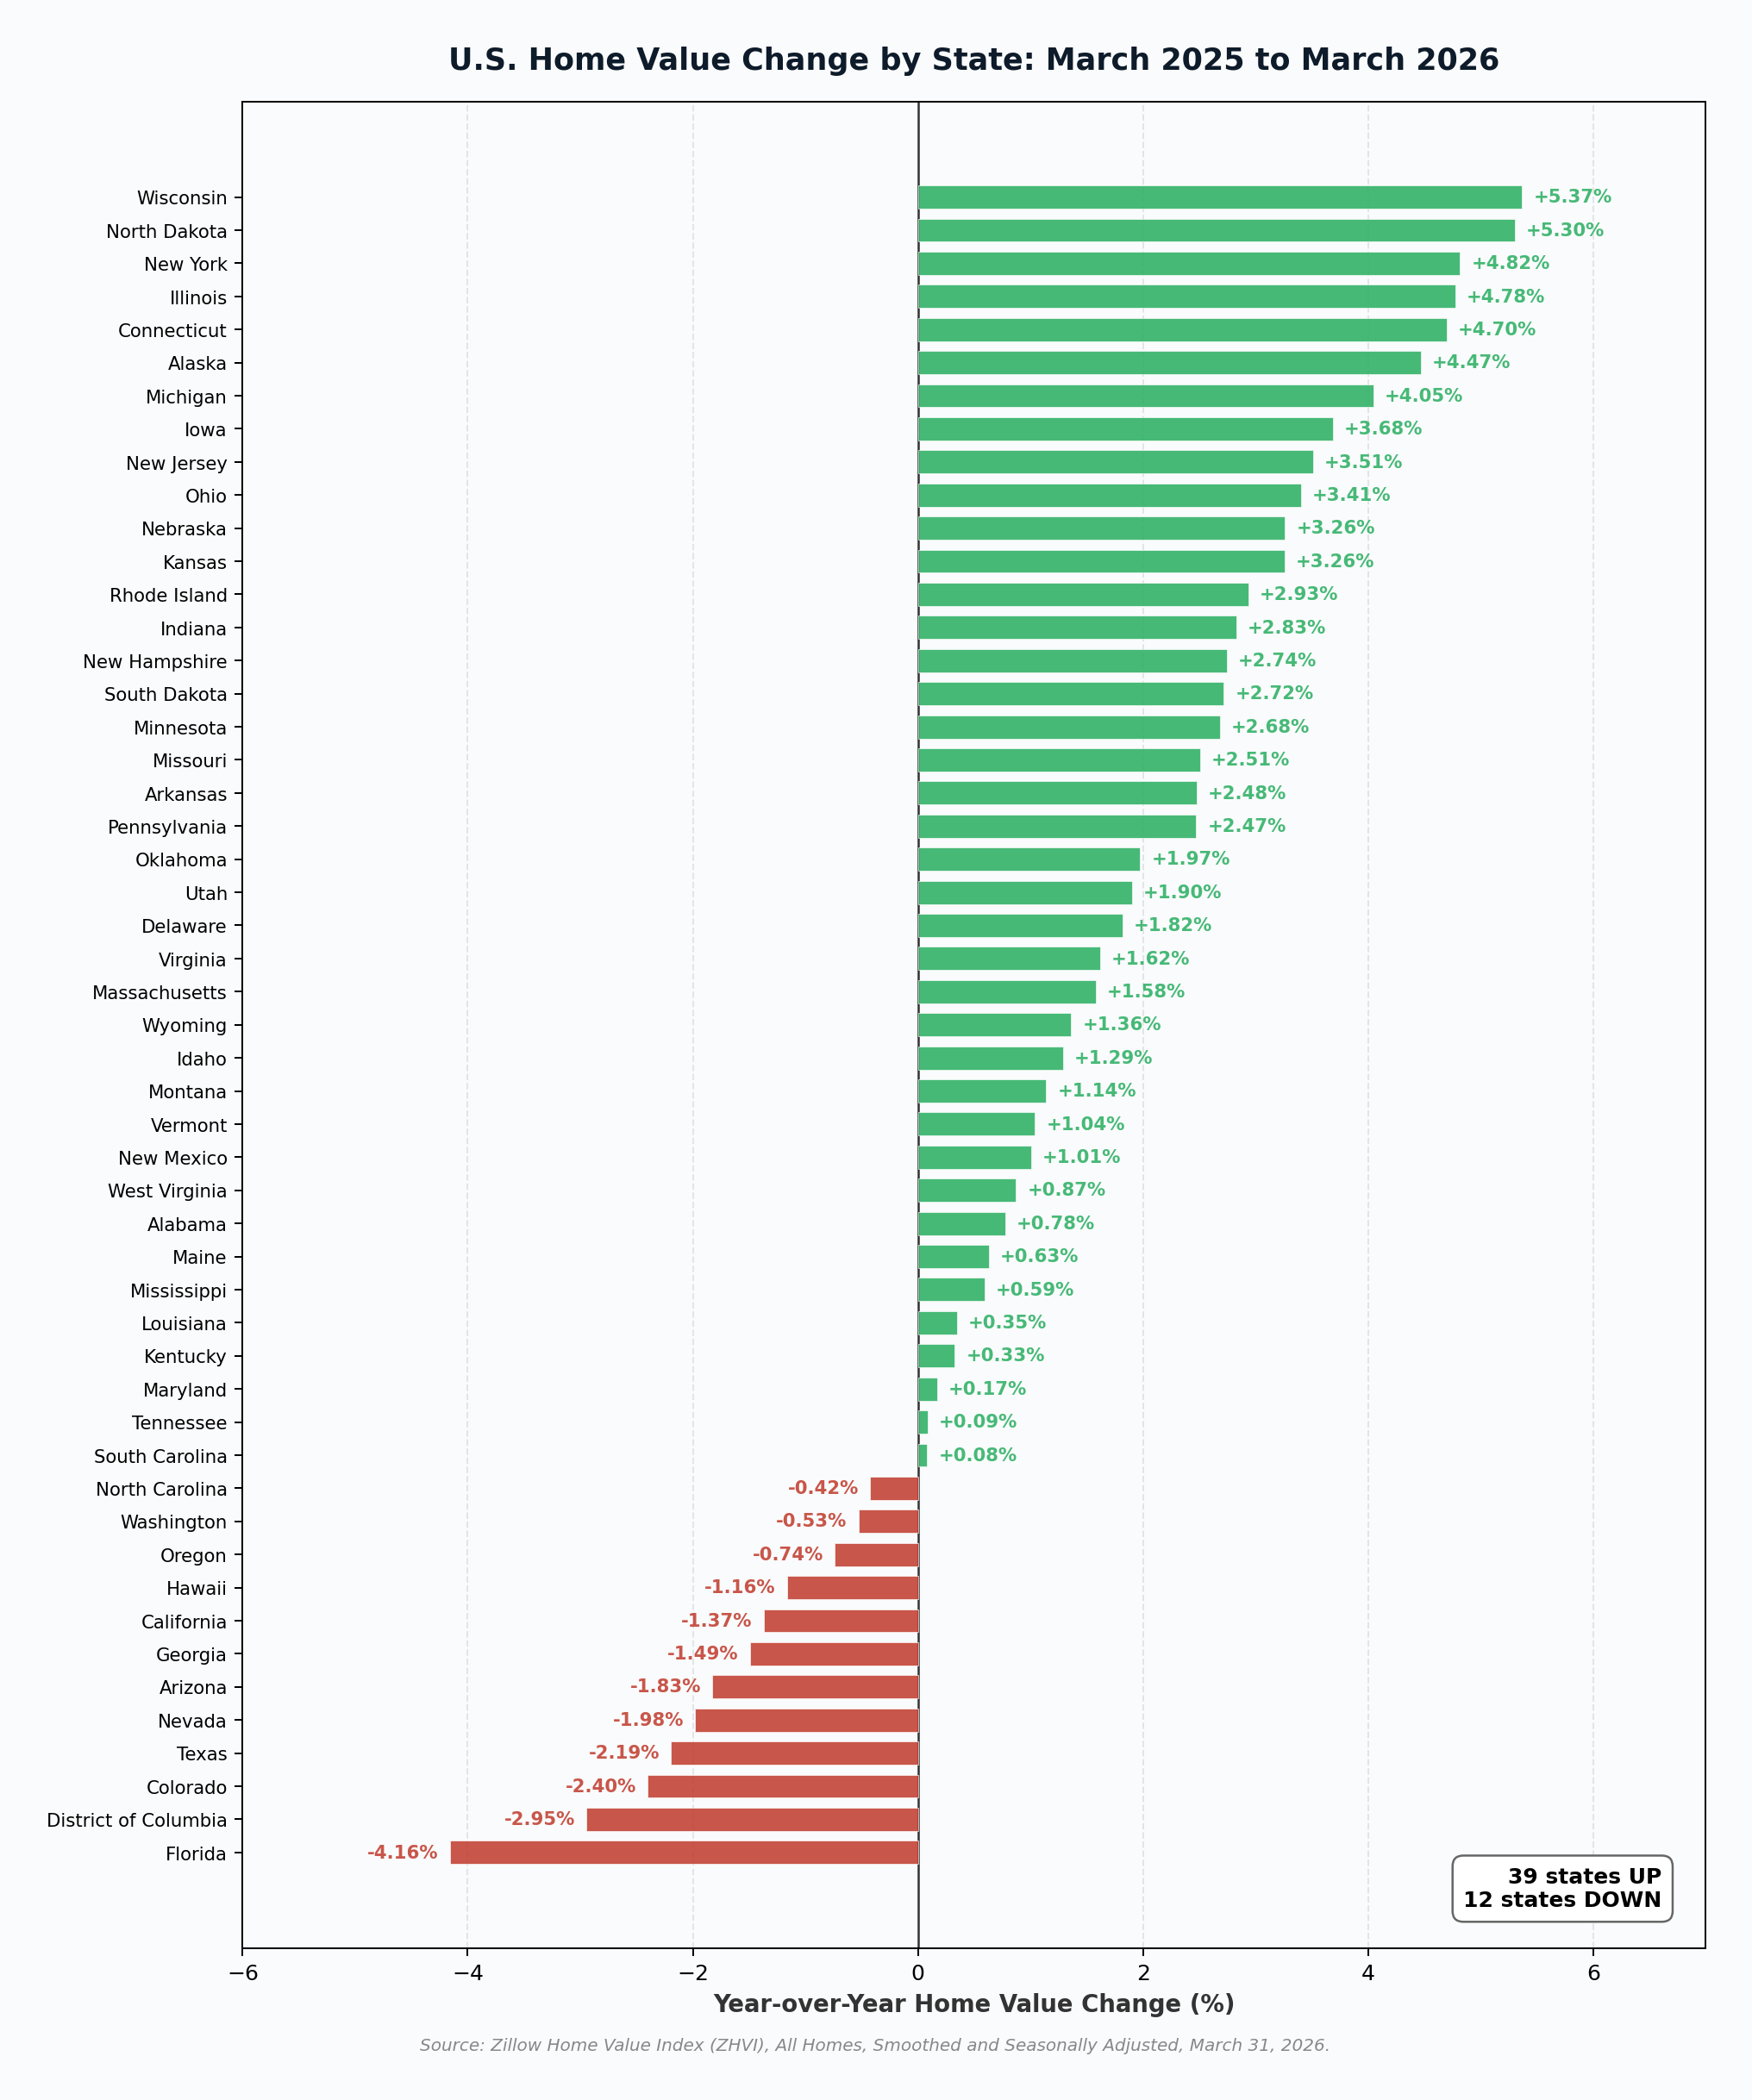
The table below presents typical home values and year-over-year changes for all 50 U.S. states plus the District of Columbia, derived from the Zillow Home Value Index (ZHVI) for All Homes (Smoothed, Seasonally Adjusted) for the period ending March 31, 2026 (Zillow Research, 2026a). Of 51 jurisdictions tracked, 39 posted positive year-over-year home value growth and 12 posted declines.
| State / D.C. | Typical Home Value (Mar 2026) | Direction | YoY % Change |
|---|---|---|---|
| Alabama | $236,453 | UP | +0.78% |
| Alaska | $387,636 | UP | +4.47% |
| Arizona | $423,330 | DOWN | -1.83% |
| Arkansas | $222,050 | UP | +2.48% |
| California | $774,582 | DOWN | -1.37% |
| Colorado | $541,842 | DOWN | -2.40% |
| Connecticut | $436,407 | UP | +4.70% |
| Delaware | $402,891 | UP | +1.82% |
| District of Columbia | $583,084 | DOWN | -2.95% |
| Florida | $375,662 | DOWN | -4.16% |
| Georgia | $332,063 | DOWN | -1.49% |
| Hawaii | $832,967 | DOWN | -1.16% |
| Idaho | $473,335 | UP | +1.29% |
| Illinois | $285,736 | UP | +4.78% |
| Indiana | $254,122 | UP | +2.83% |
| Iowa | $231,585 | UP | +3.68% |
| Kansas | $244,761 | UP | +3.26% |
| Kentucky | $231,894 | UP | +0.33% |
| Louisiana | $211,635 | UP | +0.35% |
| Maine | $407,566 | UP | +0.63% |
| Maryland | $429,705 | UP | +0.17% |
| Massachusetts | $656,690 | UP | +1.58% |
| Michigan | $259,857 | UP | +4.05% |
| Minnesota | $346,668 | UP | +2.68% |
| Mississippi | $192,906 | UP | +0.59% |
| Missouri | $263,040 | UP | +2.51% |
| Montana | $466,917 | UP | +1.14% |
| Nebraska | $276,500 | UP | +3.26% |
| Nevada | $446,865 | DOWN | -1.98% |
| New Hampshire | $507,347 | UP | +2.74% |
| New Jersey | $569,411 | UP | +3.51% |
| New Mexico | $316,750 | UP | +1.01% |
| New York | $507,794 | UP | +4.82% |
| North Carolina | $336,408 | DOWN | -0.42% |
| North Dakota | $284,076 | UP | +5.30% |
| Ohio | $242,141 | UP | +3.41% |
| Oklahoma | $220,468 | UP | +1.97% |
| Oregon | $499,004 | DOWN | -0.74% |
| Pennsylvania | $282,736 | UP | +2.47% |
| Rhode Island | $499,272 | UP | +2.93% |
| South Carolina | $304,083 | UP | +0.08% |
| South Dakota | $317,148 | UP | +2.72% |
| Tennessee | $333,651 | UP | +0.09% |
| Texas | $300,957 | DOWN | -2.19% |
| Utah | $537,810 | UP | +1.90% |
| Vermont | $394,038 | UP | +1.04% |
| Virginia | $412,467 | UP | +1.62% |
| Washington | $601,016 | DOWN | -0.53% |
| West Virginia | $174,412 | UP | +0.87% |
| Wisconsin | $330,171 | UP | +5.37% |
| Wyoming | $363,227 | UP | +1.36% |
Key takeaways from the state-level data:
- Top 5 gainers: Wisconsin (+5.37%), North Dakota (+5.30%), New York (+4.82%), Illinois (+4.78%), Connecticut (+4.70%). The leaders are concentrated in the Midwest and Northeast where supply remains tight.
- Top 5 decliners: Florida (-4.16%), D.C. (-2.95%), Colorado (-2.40%), Texas (-2.19%), Nevada (-1.98%). The pattern is consistent with the broader Sun Belt softening trend.
- Highest typical value: Hawaii ($832,967), California ($774,582), Massachusetts ($697,340 region-equivalent based on ZHVI). Lowest: West Virginia ($171,213), Mississippi ($186,543), Arkansas (~$205K).
- Regional pattern: Of 12 states with declining values, 9 are in the South or West. Of the 39 states with positive growth, the Northeast and Midwest are most heavily represented.
Beyond the state level, the divergence is even more pronounced at the metro level. Among the 100 largest metros tracked by FHFA, year-over-year price changes ranged from a 9.1% decline in Cape Coral-Fort Myers, FL to an 8.9% increase in Allentown-Bethlehem-Easton, PA-NJ (FHFA, 2026). Austin (-7.9% YoY median list price) and Memphis (-10.3%) recorded the largest metro list-price drops, while Providence (+9.8%) and Indianapolis (+6.3%) led on the price-per-square-foot measure (Realtor.com, 2026).
Section 3: Sales Data Comparison
A. Existing-Home Sales (March 2026 vs February 2026)
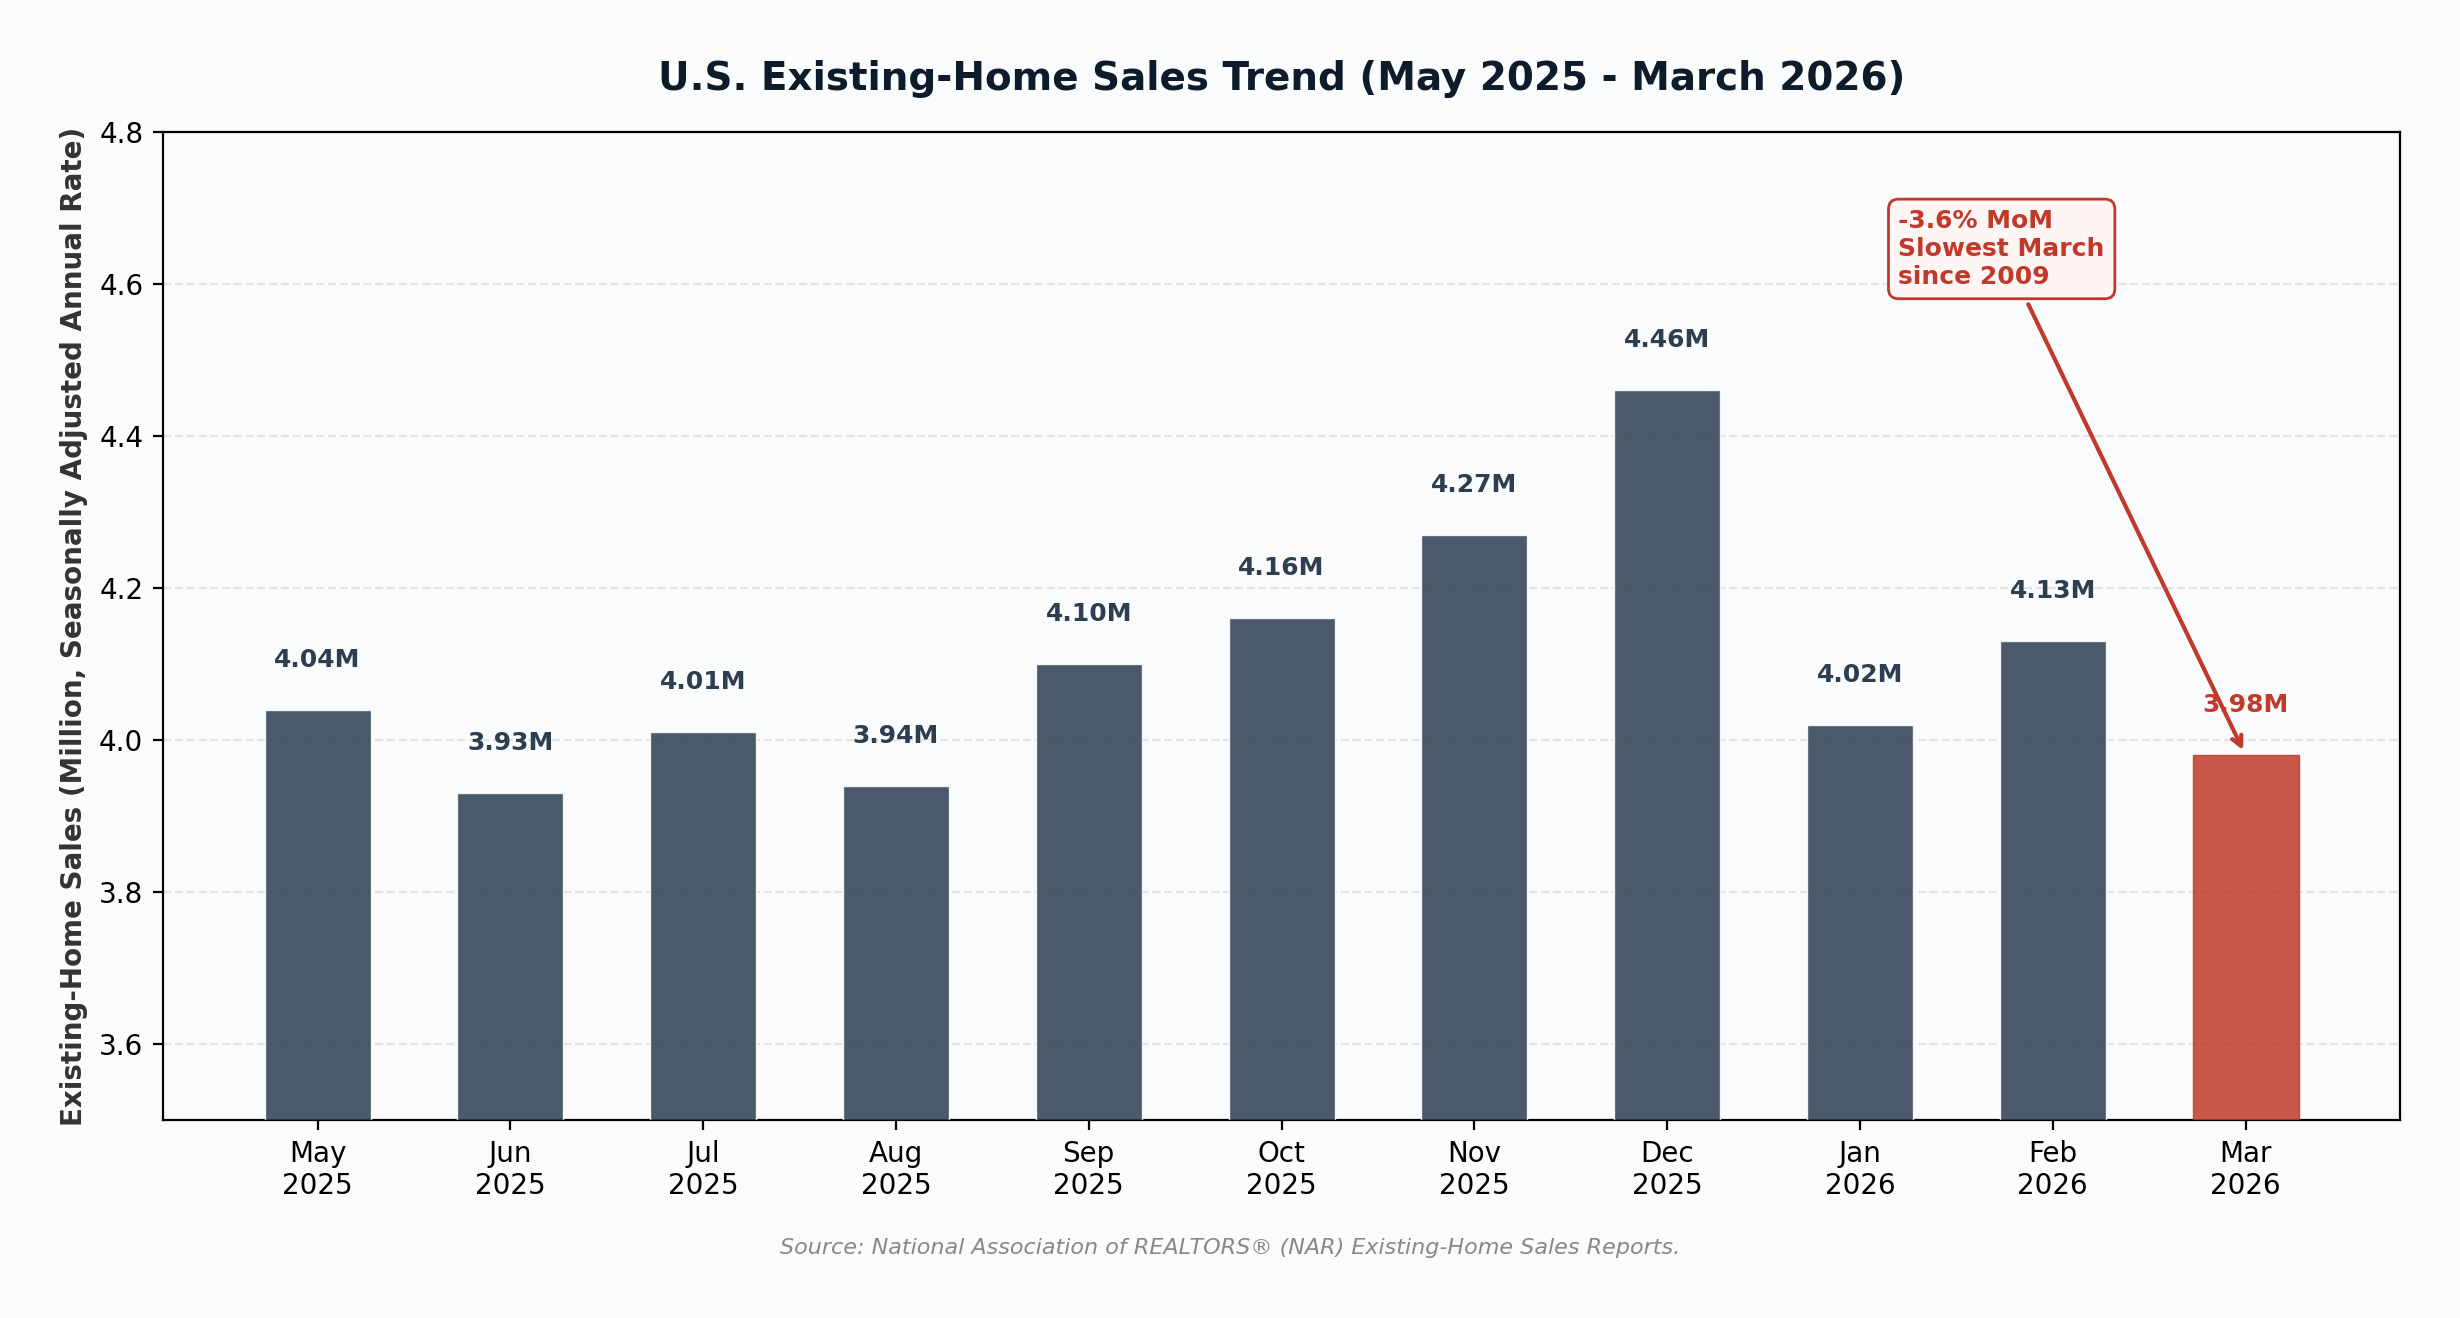
Existing-home sales fell 3.6% month over month in March 2026 to a seasonally adjusted annual rate of 3.98 million units, down from 4.13 million in February. Year over year, sales were down 1.0% (NAR, 2026a). According to REI Prime, this was “the slowest March print since 2009, when the housing market was bottoming out of the global financial crisis” (REI Prime, 2026). All four U.S. regions posted sales declines on a monthly basis, but the South and West remained positive year over year (NAR, 2026a).
B. New Home Sales (Latest Available)
The most recent Census Bureau new home sales release covers January 2026 (March and February 2026 data not yet released by Census Bureau as of April 27, 2026). According to the Census Bureau and HUD joint release on March 19, 2026:
- New home sales (Jan 2026): 587,000 SAAR, down 17.6% from December 2025 and down 11.3% year over year (Census Bureau, 2026).
- Median new home sales price (Jan 2026): $400,500, down 4.5% from December 2025’s $419,200 and down 6.8% year over year (Census Bureau, 2026).
- New home inventory (Jan 2026): 476,000 units for sale, equivalent to a 9.7-month supply at the current sales pace (Census Bureau, 2026).
C. Pending Home Sales (March 2026 vs February 2026)
NAR’s Pending Home Sales Index rose 1.5% month over month in March 2026 but declined 1.1% year over year (NAR, 2026b). This was the second consecutive monthly increase, following February’s 1.8% MoM gain. Pending sales are a leading indicator of closed transactions one to two months ahead, suggesting modest improvement in April and May closings.
Data Note
April 2026 monthly housing data is not yet fully released. Realtor.com weekly data through April 18, 2026 shows new listings up 12.9% YoY and active inventory up 4.8% YoY, with mortgage rates pulling back from their early-April spike (Realtor.com, 2026). NAR will release April existing-home sales on May 22, 2026.
Section 4: Key Insights
1. Demand and supply are both weakening, in different ways. Inventory rose 2.3% YoY in March, but the pace of inventory growth is decelerating from the double-digit YoY gains seen in 2024. Closed sales fell 3.6% MoM. The result: a market with more options for buyers, but with buyers still hesitant to commit.
2. The mortgage rate cycle has not produced the expected sales boost. Despite rates falling from 6.81% one year ago to 6.23% in late April 2026, March existing-home sales hit their slowest March pace since 2009. Lawrence Yun, NAR Chief Economist, noted that “housing demand remains muted” compared to pre-pandemic levels and that affordability remains “the principal challenge” (NAR, 2026a). The 70 to 80 basis point decline in rates has not been enough to offset the cumulative price appreciation since 2020 (median price up roughly 47% since March 2020 according to NAR data).
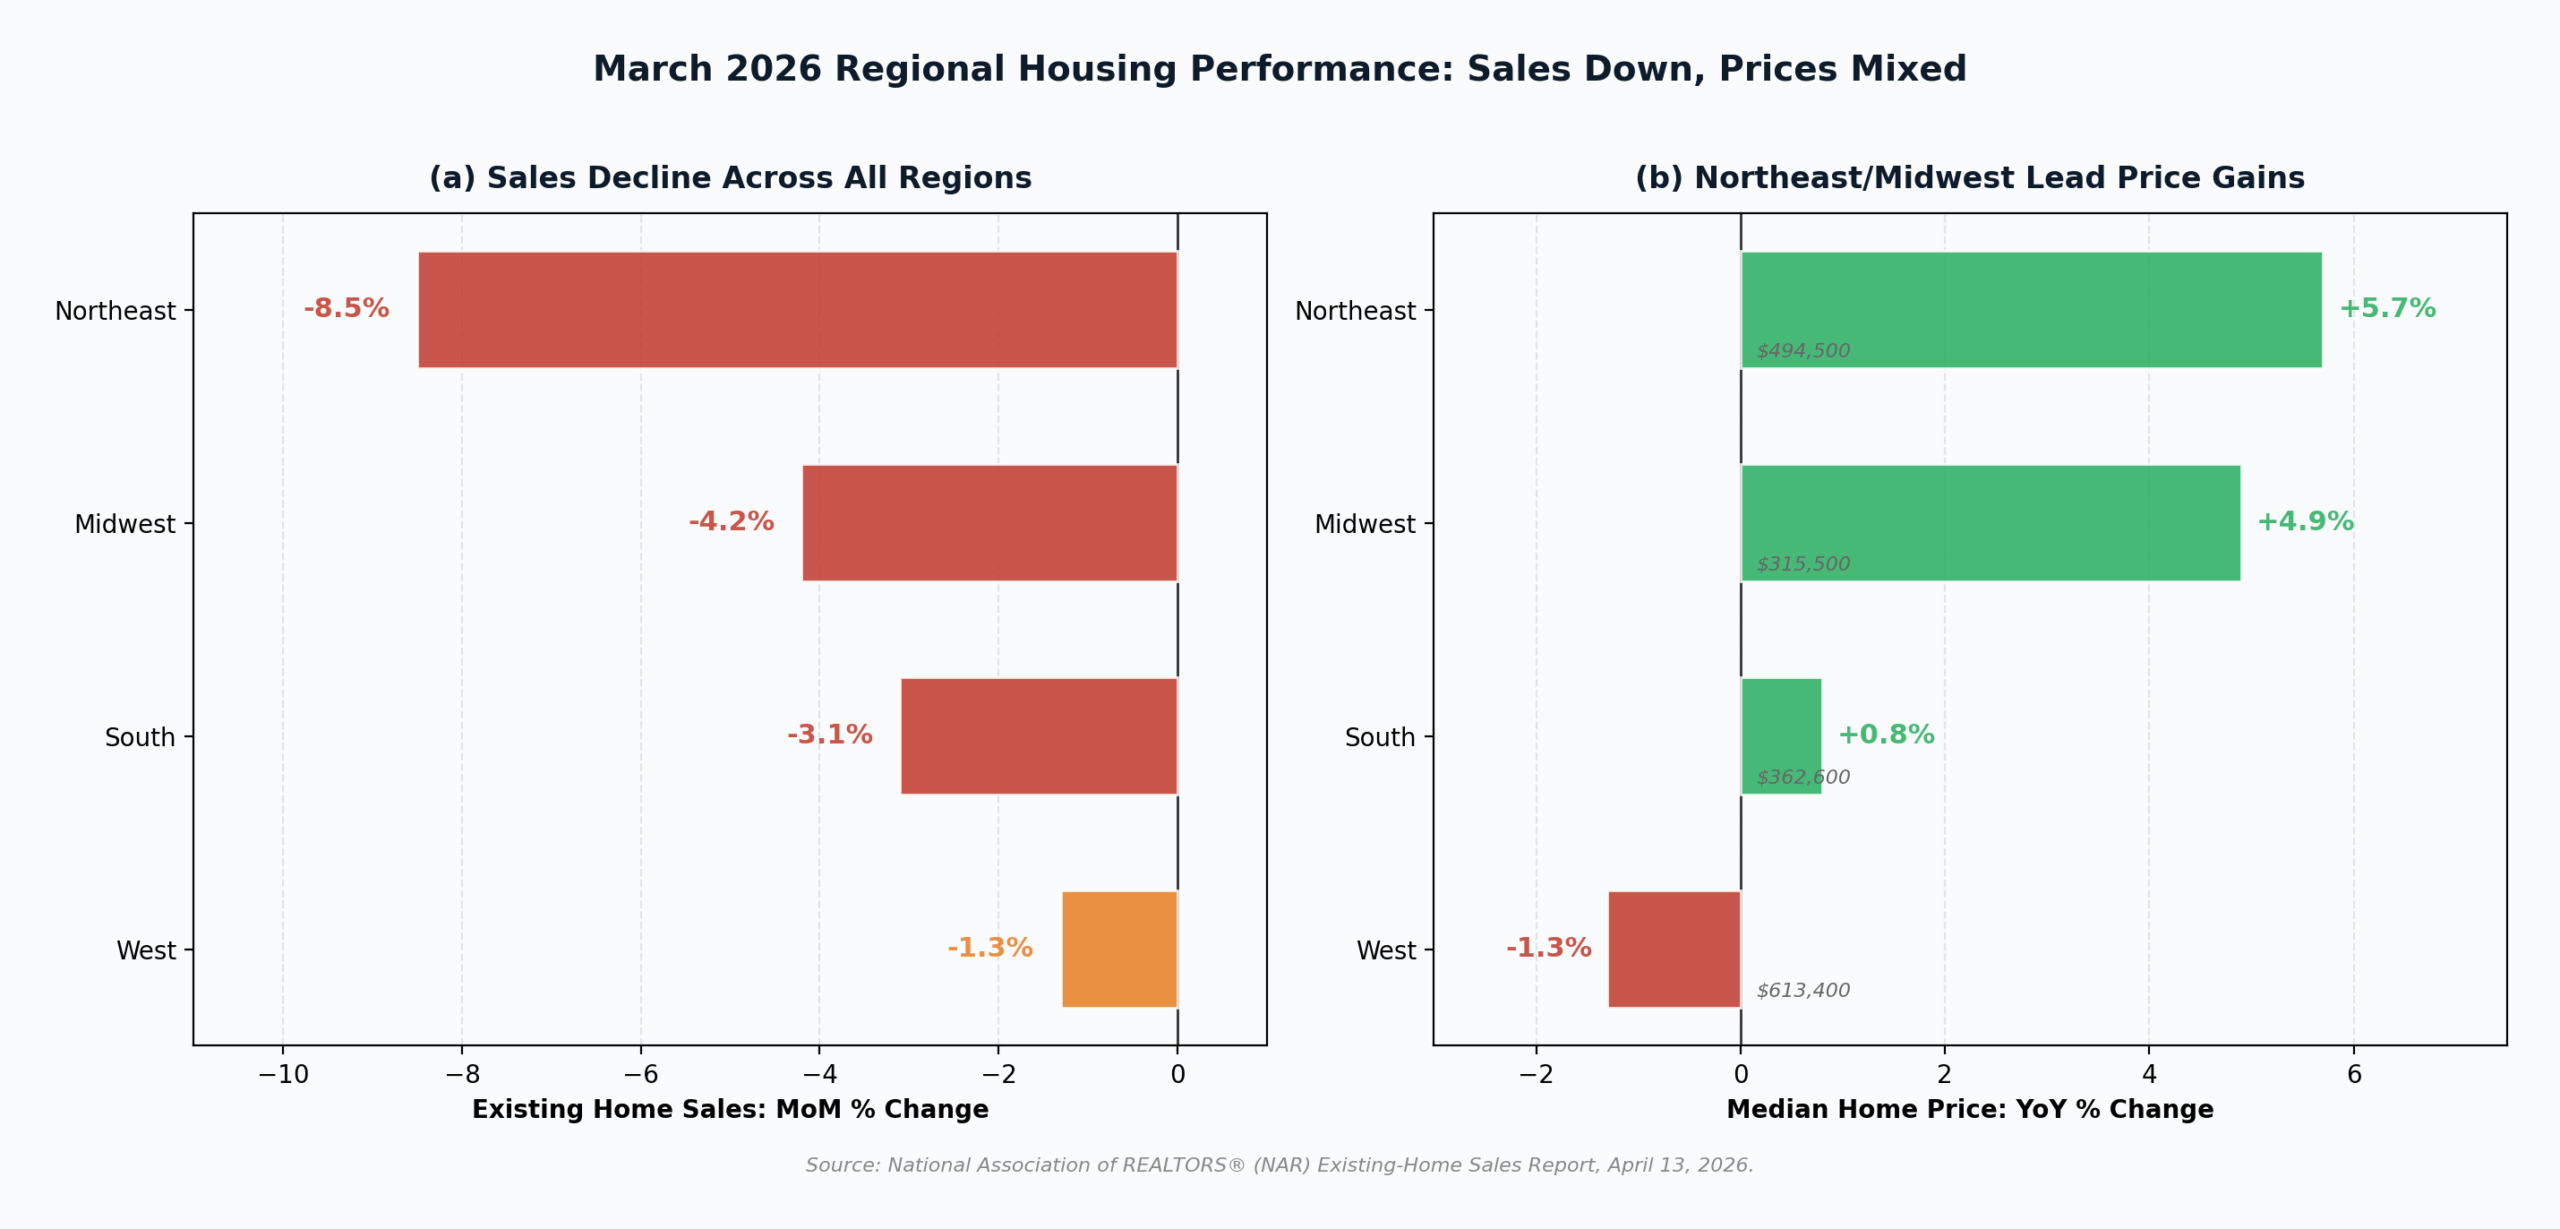
3. Regional divergence is widening. The Northeast and Midwest are sustaining the strongest price growth (+5.7% and +4.9% YoY), driven by persistent supply deficits (Northeast inventory remains 54.1% below pre-pandemic levels; Midwest 37.8% below) (Realtor.com, 2026). The South and West, where supply has recovered closer to pre-pandemic norms, are seeing flatter or declining prices.
4. The buyer-seller balance has tilted, but unevenly. Nationally, 16.2% of listings saw a price cut in March 2026, down 1.2 percentage points YoY but still elevated by historical standards (Realtor.com, 2026). Buyer leverage is strongest in the South (18.4% price-cut share) and West (17.3%) and weakest in the Northeast (9.1%) and Midwest (12.4%). RE/MAX data shows the median sales price reached $440,000 across 50 metros, up only 1.1% YoY, the slowest growth in years (RE/MAX, 2026).
5. New construction is cooling faster than existing. January 2026 new home sales fell 17.6% MoM, with median new home prices down 6.8% YoY. Builders facing softer demand and tariff-related cost pressure are responding by cutting prices and offering incentives, putting additional downward pressure on the South and West where new construction is concentrated.
Section 5: Prediction for the Rest of 2026

Home prices: modest gains, with regional divergence widening. NAR maintains its forecast for a 4% increase in median existing-home prices for 2026 (NAR, 2026a). Zillow’s April 2026 forecast calls for a 0.3% rise in the typical home value (ZHVI) by December 2026, a downward revision from earlier projections (Zillow Research, 2026c). J.P. Morgan expects home prices to “stall at 0% growth this year” (Forbes, 2026). The wide divergence reflects different methodologies (median sale price vs typical home value) and different assumptions about inventory growth. Our base case: nationally flat to +1.5% appreciation through year-end, with the Northeast and Midwest outperforming and Florida, Texas, and parts of the West Coast continuing to soften.
Sales volume: modest improvement on weak base. NAR’s April 2026 update revised existing-home sales upward by 4% for 2026, while Zillow projects 4.13 million existing-home sales (NAR measure), up 1.6% from 2025 (Zillow Research, 2026c). Both forecasts imply that the second half of 2026 will outpace the first half, supported by lower mortgage rates, improving inventory, and the release of pent-up demand among first-time buyers.
Mortgage rates: gradual decline, but volatile. Most forecasters expect 30-year fixed rates to drift toward the 5.75% to 6.25% range by year-end, contingent on the Federal Reserve’s next move. The FOMC held rates steady at 3.5% to 3.75% at its March 2026 meeting (Forbes, 2026), with the next decision scheduled for April 28-29. Rate volatility tied to geopolitical events (Iran conflict in late March added 40 basis points in two weeks) is likely to persist.
Section 6: Should You Wait to Buy a Home?
Arguments FOR Waiting
1. Inventory and affordability conditions are still improving. Active listings are up 8.1% YoY and price cuts remain elevated at 16.2% of listings. With Zillow forecasting only 0.3% home value growth in 2026 and J.P. Morgan calling for 0% growth, prospective buyers face minimal price-appreciation risk by waiting (Zillow Research, 2026c; Forbes, 2026). If rates drift toward 5.75% to 6% by late 2026 as some forecasters expect, the combination of lower rates and flat prices would meaningfully improve affordability for buyers willing to be patient.
2. Specific markets are clearly softening. The Sun Belt, particularly Florida (-4.16% YoY ZHVI), Arizona (-1.83% YoY ZHVI), and Texas metros like Austin (-7.9% YoY median list price) and San Antonio (-3.3%), is seeing clear price declines (Realtor.com, 2026; Zillow Research, 2026a). Buyers in these markets have more leverage now than at any point since 2020 and may see further price drops as builders continue to discount inventory.
Arguments AGAINST Waiting
1. Tight-supply markets continue to see meaningful price gains. The Northeast (+5.7% YoY) and Midwest (+4.9% YoY) are setting new median price records, and forecasts for top markets like Hartford (+3.9%), Buffalo (+2.5%), and Providence (+2%) call for continued appreciation through 2026 (Zillow Research, 2026c; NAR, 2026a). In these supply-constrained markets, waiting carries clear price-appreciation risk that may exceed any savings from lower rates. The typical homeowner has accumulated $128,100 in housing wealth over the past six years, according to NAR (NAR, 2026a).
2. Lower rates have already reduced monthly payment burdens. A buyer who purchased a typical $357,445 home in January 2026 at the prevailing 6.10% mortgage rate is paying $1,732 per month in principal and interest, compared to $1,889 for a comparable purchase one year earlier at 6.95% (Forbes, 2026). That is $157 per month and $56,953 over the life of the loan. With current rates at 6.23%, the payment math remains favorable. Orphe Divounguy, senior macroeconomist at Zillow Home Loans, notes that “the housing market, like so many other markets, is almost impossible to time. The best time for prospective buyers is when they find a home that they like, that meets their family’s current and foreseeable needs, and that they can afford” (Forbes, 2026).
Bottom Line
The decision to buy or wait is fundamentally a regional one in 2026. Buyers in the Northeast and Midwest face continuing price pressure and tight supply: waiting carries appreciation risk. Buyers in Florida, Arizona, Texas, and parts of the West Coast face the opposite: softening prices and rising inventory mean patience could pay off. For most buyers, however, the Zillow advice holds: time the personal decision, not the market. With mortgage rates at three-year spring lows and inventory at five-year highs, this market offers more options for buyers than at any point since the pandemic began.
References
Census Bureau. (2026, March 19). Monthly new residential sales, January 2026. U.S. Census Bureau and U.S. Department of Housing and Urban Development. https://www.census.gov/construction/nrs/pdf/newressales.pdf
Federal Housing Finance Agency. (2026, March 4). House price appreciation by state and metro area: Fourth quarter 2025. Eye on Housing. https://eyeonhousing.org/2026/03/house-price-appreciation-by-state-and-metro-area-fourth-quarter-2025/
Forbes Advisor. (2026, March 23). Housing market predictions for 2026: When will home prices drop? https://www.forbes.com/advisor/mortgages/real-estate/housing-market-predictions/
Freddie Mac. (2026, April 23). Primary Mortgage Market Survey. https://www.freddiemac.com/pmms
National Association of REALTORS®. (2026a, April 13). NAR existing-home sales report shows 3.6% decrease in March. https://www.nar.realtor/newsroom/nar-existing-home-sales-report-shows-3-6-decrease-in-march
National Association of REALTORS®. (2026b, April 21). NAR pending home sales report shows 1.5% increase in March. https://www.nar.realtor/newsroom/nar-pending-home-sales-report-shows-1-5-increase-in-march
Realtor.com. (2026, April 1). March 2026 monthly housing report: Spring’s slow start. https://www.realtor.com/research/march-2026-data/
REI Prime. (2026, April 23). NAR: March home sales hit 3.98M, slowest since 2009. https://reiprime.com/news/2026-04-23-nar-march-sales-slowest-since-2009
RE/MAX. (2026, April 20). RE/MAX March 2026 national housing report shows spring sales picking up. https://www.morningstar.com/news/pr-newswire/20260420la37608/remax-march-2026-national-housing-report
Stock Titan. (2026, April 24). Freddie Mac 30-year mortgage rate falls to 6.23%. https://www.stocktitan.net/news/FMCC/the-30-year-fixed-rate-mortgage-declines-emuhaag7oh2a.html
Zillow Research. (2026a, April). Zillow Home Value Index (ZHVI), All Homes (Smoothed, Seasonally Adjusted) state-level data through March 31, 2026. https://files.zillowstatic.com/research/public_csvs/zhvi/State_zhvi_uc_sfrcondo_tier_0.33_0.67_sm_sa_month.csv
Zillow Research. (2026b, April 6). Spring housing market accelerates despite mortgage rate spike. https://www.zillow.com/research/march-2026-market-report-36208/
Zillow Research. (2026c, April 17). Zillow home value and home sales forecast (April 2026). https://www.zillow.com/research/home-value-sales-forecast-33822/