
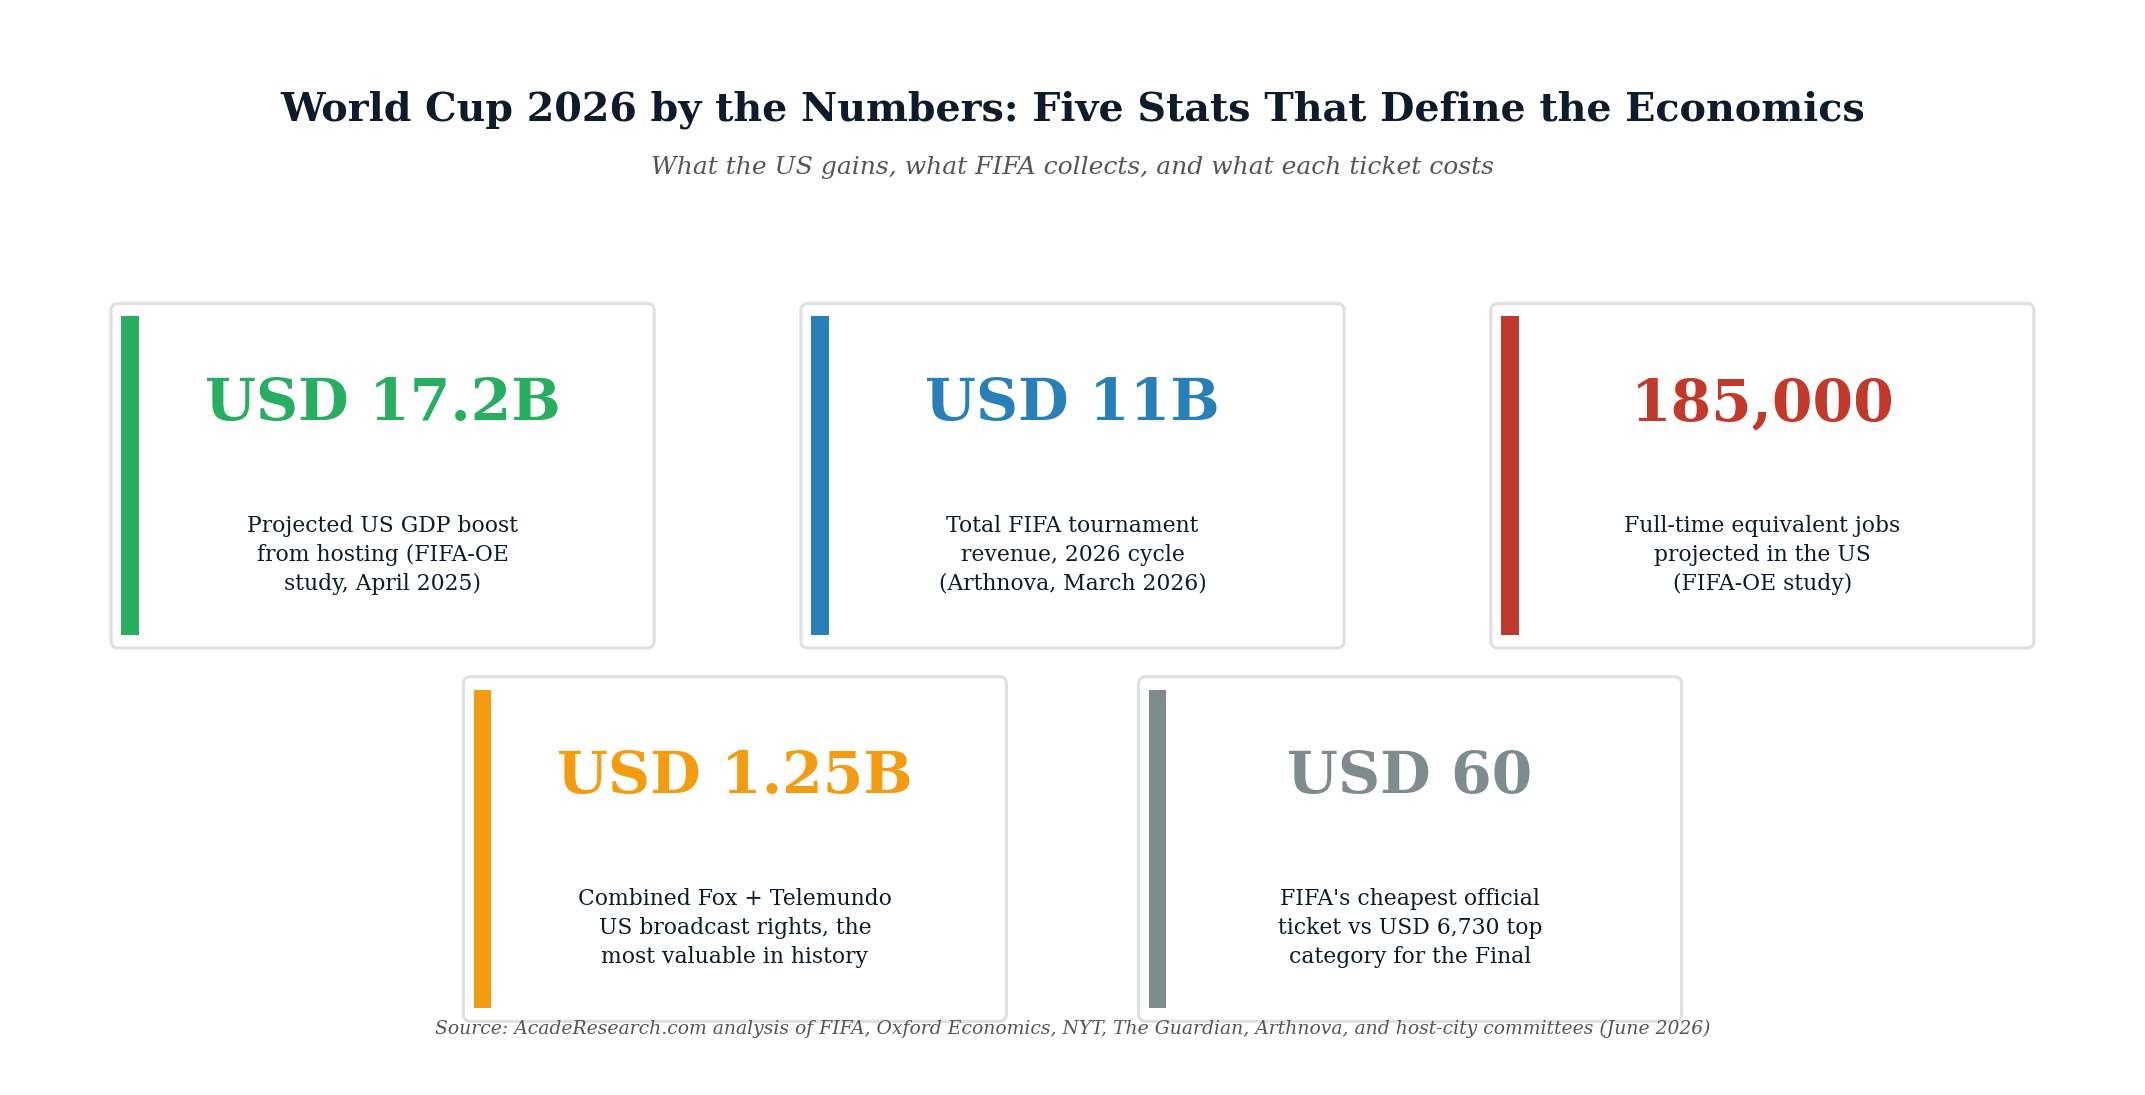
FIFA projects $17.2 billion in added US GDP. Fox and Telemundo paid $1.25 billion for the broadcast rights. The cheapest official ticket is $60. A single Final ticket recently listed for $11.5 million. The 2026 World Cup, which kicked off this week in the United States, Canada, and Mexico, is a study in extremes: massive headline projections sitting alongside the increasingly visible reality that the economics may not be what the host cities were promised.
By Jane Le
The 23rd FIFA World Cup opened on June 11, 2026, marking the first time the United States has hosted a World Cup since 1994 and the first time the tournament has been held across three countries. The 48-team format, expanded from 32, will play 104 matches across 16 host cities through the July 19 Final at MetLife Stadium in East Rutherford, New Jersey. FIFA estimates 6.5 million spectators will attend in person, with global television audiences projected in the multi-billion range (FIFA, 2025).
The economic question every host city has been promised an answer to is straightforward: what does it actually mean, in dollars, jobs, and tax revenue, to host the world’s most-watched sporting event? Below are the five numbers that define the answer, the four cases of how host cities are positioned, and the contrarian view from one of the leading academic economists on sports mega-events.
The Headline Numbers
The most cited figure in 2026 World Cup coverage is the FIFA-commissioned Oxford Economics study released in April 2025. That analysis projected that across the three host countries the tournament could drive up to $40.9 billion in global GDP, $30.5 billion in gross output across the US specifically, $17.2 billion in US GDP, and support the creation of approximately 824,000 full-time equivalent jobs globally, including 185,000 in the United States (FIFA-WTO study, 2025; Steakin, 2026).
FIFA’s own projected revenue from the 2023 to 2026 cycle is approximately $11 billion, with the 2026 World Cup contributing the majority. The Guardian’s April 30 analysis put the breakdown at roughly $4.26 billion from broadcasting rights, $2.69 billion from marketing and commercial rights, and $3.1 billion from tickets and hospitality (The Guardian, 2026).
The broadcast rights deserve specific attention. Fox Sports holds the English-language US rights at approximately $480 million, with reporting indicating a $180 million bonus tied to US hosting. Telemundo holds the Spanish-language US rights at approximately $465 million plus a $115 million hosting bonus. The combined Fox-Telemundo package, worth roughly $1.25 billion, is the single most valuable territorial broadcast deal in World Cup history (New York Times, 2026 via industry reporting; Animal House USA, 2026). Industry analysts cited by The Guardian estimate the actual market value of the Fox deal today is somewhere between $1 billion and $1.5 billion, meaning Fox is receiving a billion-dollar product for less than half its true market price, the result of a clause Fox triggered when FIFA moved the 2022 Qatar World Cup from summer to winter.
On the spending side, Allianz Trade’s June 10 analysis estimates that international visitors will spend roughly $350 per day in the US over an 8-to-10-day average stay, with foreign visitors making up approximately 40 percent of total attendees (Allianz Trade, 2026). That spending fans out across hotels, restaurants, ground transportation, and retail in roughly equal shares, with hospitality accounting for the largest single category at 31,660 of the projected 185,000 US jobs (PanamericanWorld, 2025).
The Ticket Pricing Story
FIFA’s own pricing for the 2026 tournament is the most aggressive in World Cup history. Official ticket prices range from $60 for the cheapest group-stage seats to approximately $6,730 for top-category Final tickets. Group-stage matches involving the host nations carry top-category prices reaching $2,735. Round-of-16 top-tier tickets cost roughly $980, quarterfinals approximately $1,775, and semifinals around $3,295 (Arthnova, 2026).
The official secondary market has produced extreme outcomes. The Final match on July 19 was listed as not available on FIFA’s website while Ticketmaster listings showed prices starting around $9,200 and reaching as high as $43,553. On FIFA’s own official resale platform, a single Final ticket was recently listed at $11.5 million (Al Jazeera, 2026; YouTube primary-source compilation, 2026). The hospitality program, run exclusively by On Location (a TKO subsidiary), prices premium packages for the Final at MetLife Stadium between $20,000 and $50,000 per person (Arthnova, 2026).
For comparison, the 2022 Qatar World Cup priced top group-stage seats at roughly $220, with Qatari residents able to attend for as little as $11. FIFA’s 2026 dynamic pricing represents a five-to-ten-fold increase over the previous cycle. After significant global backlash, FIFA announced a new $60 ticket category for every match, though only a fraction of each match’s total allocation is sold at that price.
The ticketing arithmetic, if FIFA hits its $3.1 billion projection at an estimated average ticket price of approximately $300, implies roughly 10 million paid attendances across the 104 matches, well above the 6.5 million unique-spectator figure. The reconciliation runs through hospitality multipliers and multiple-match attendance per visitor.
Which US Host Cities Stand to Gain Most
The 11 US host cities have published widely varying economic projections, with the largest figures concentrated in cities hosting more matches or knockout rounds (Doc’s Sports, 2026).
New York / New Jersey leads on every measure: $3.3 billion projected economic impact, more than 26,000 jobs, more than 1.2 million visitors, 8 matches including the Final, and $432 million in state and local tax revenue. Dallas / Fort Worth projects $1.5 to $2.1 billion in impact with 9 matches including a semifinal. Boston / New England projects $1.1 billion across 7 matches. Seattle reports $929 million with 750,000 visitors and more than $100 million in state and local taxes. Los Angeles projects $892 million to $1.1 billion with $515 million in direct visitor spending and approximately 180,000 out-of-town visitors. Kansas City, the smallest-market host, projects $653 million with 650,000 expected fans.
Houston, Miami, and Atlanta each project approximately $500 million to $1.5 billion. Philadelphia, hosting a Round-of-16 game scheduled for July 4 (overlapping the 250th anniversary of US independence), projects $500-plus million and has positioned the World Cup as “the largest financial boost from a single event in Philadelphia’s history” according to consulting firm Collier’s (Steakin, 2026).
What the host-city projections share is a uniform methodology: total projected visitor spending plus indirect economic activity, before subtracting public-sector hosting costs. The public-sector cost figures are conspicuously absent from most of the host-city marketing materials.
The Contrarian View: What the Academic Literature Says
The most pointed counter to the host-city projections has come from Andrew Zimbalist, the Robert A. Woods Professor Emeritus of Economics at Smith College and a widely cited academic specialist on the economics of sports mega-events. In a June 11, 2026 interview, Zimbalist stated plainly: “There are very, very significant costs to host cities, which host anywhere from four to eight games. I think it’s fair to say that none of them will benefit economically from the World Cup because they don’t get the revenue, but they get the costs, which can run well over $100 million” (Smith College, 2026).
Zimbalist’s argument is that the standard host-city projection methodology systematically overstates net benefits because it does not account for crowding-out effects: when soccer fans arrive in a host city, other tourists and even some local residents leave to avoid traffic, security, and elevated prices. “What could theoretically be a small positive contribution to the local economy is much more likely to be a neutral or negative effect from tourism, but an immense $100 million-plus of expenses. Without any of the revenue, it’s not a very good bargain at all.”
Saxo Bank reached a similar conclusion in late May 2026, finding that the projected $17.2 billion GDP gain to the United States would amount to less than 0.1 percent of annual US GDP. The bank’s report concluded directly: “In other words, the 2026 World Cup is not a meaningful growth driver for the United States” (Steakin, 2026).
Both critiques agree on the macro point. At the national US level, even FIFA’s own projected $17.2 billion gain represents roughly 0.06 percent of the $29 trillion US economy. The numbers that look large in absolute terms are small relative to the base.
The same critiques become weaker, however, when applied at the city level. Seattle’s projected $929 million impact represents a much larger share of the Seattle metropolitan economy than the national figure represents of the national economy. Kansas City’s projected $653 million is a meaningful single-event boost for a metropolitan economy of its size. The economic dispute is not whether hosting produces some economic activity. It is whether the activity exceeds the public-sector cost of hosting and whether the crowding-out effects neutralize much of the visible gain.
The Demand Reality Check
The most current data, with the tournament now underway, suggests the actual visitor surge is falling short of pre-tournament projections in several host cities. Al Jazeera reported on June 8 that ticket prices have remained elevated, hotel reservations have come in below expectations, and overall economic instability is undermining the demand for tournament-related travel (Al Jazeera, 2026). The British Columbia Hotel Association observed in May that “despite its global reach, FIFA has not generated the widespread hotel demand many anticipated” in Vancouver. Similar reports have surfaced from Dallas, Houston, and Atlanta.
Several forces appear to be at work. Ticket prices five to ten times higher than the previous tournament have priced out a meaningful share of the international fan base. Visa processing delays have constrained travel from several large international markets. And the broader macro environment, including elevated inflation in transportation and lodging, has made the trip more expensive for fans even before ticket prices are factored in.
The economic context. The FIFA-Oxford Economics projection of $17.2 billion in added US GDP would amount to less than 0.1 percent of US GDP, a figure that Saxo Bank explicitly described as not a meaningful national growth driver. The same figure, distributed across 11 US host cities over six weeks, represents a meaningful but not transformative boost to individual metropolitan economies. The 185,000 projected US jobs are largely temporary, concentrated in hospitality and tourism services, and are an annualized full-time-equivalent figure rather than 185,000 permanent positions. The numbers that look transformative at the headline level become more modest when broken down into per-city, per-month, and net-of-cost terms. That distinction matters more than the headline.
The Bottom Line
The 2026 World Cup is the largest single sporting event ever staged, with 6.5 million expected spectators across 104 matches in three countries and a FIFA-commissioned Oxford Economics projection of $17.2 billion in added US GDP, $30.5 billion in gross US output, and 185,000 full-time-equivalent US jobs. Those numbers are real and they are the largest projections FIFA has ever produced for a tournament. They are also, when measured against a US economy of roughly $29 trillion, less than 0.1 percent of annual GDP, which Saxo Bank correctly notes does not make the tournament a meaningful national growth driver. FIFA itself will generate approximately $11 billion across the 2023-2026 cycle, anchored by $4.26 billion in broadcast rights (of which Fox-Telemundo’s $1.25 billion is the largest single deal), $3.1 billion in tickets and hospitality, and $2.69 billion in marketing rights. At the city level, New York / New Jersey leads at $3.3 billion in projected impact, with seven other cities projecting at least $500 million each. The contrarian view, advanced by Smith College economist Andrew Zimbalist and corroborated by early hotel and ticket-demand data, is that host-city projections systematically understate the cost of hosting and overstate the net benefit because of crowding-out effects from displaced tourists and locals. With the tournament now underway and hotel reservations coming in below expectations in multiple host cities, both views are likely to find supporting evidence over the next five weeks. The most honest reading of the data is that the World Cup is a real but modest economic event, that the largest winners are FIFA itself and a small set of media-rights holders who locked in valuable contracts before market conditions changed, and that the host cities will benefit unevenly, with the cities hosting later-round matches faring better than those hosting only group-stage games. Whether the tournament produces the transformation that host cities were promised depends almost entirely on what is subtracted from the headline figures when the public-sector cost ledger is finally added up.
References
Al Jazeera. (2026, June 8). Will the FIFA World Cup be the economic bonanza US cities were promised? https://www.aljazeera.com/economy/2026/6/8/will-the-fifa-world-cup-be-the-economic-bonanza-us-cities-were-promised
Allianz Trade. (2026, June 10). From kickoff to cash flow: Economic spillovers from the Football World Championship 2026. https://www.allianz-trade.com/en_global/news-insights/economic-insights/From-kickoff-to-cash-flow-Football-World-Championship-2026.html
Animal House USA. (2026, March 15). Who’s cashing in during the 2026 FIFA World Cup? https://animalhouseusa.com/news/whos-cashing-in-during-the-2026-fifa-world-cup/
Arthnova. (2026, March 10). How the 2026 FIFA World Cup will become an $11 billion business. https://arthnova.com/how-the-2026-fifa-world-cup-will-become-an-11-billion-business/
Doc’s Sports. (2026, April 24). 79 2026 FIFA World Cup financial statistics. https://www.docsports.com/2026/fifa-world-cup-financial-statistics.html
FIFA. (2025, April). FIFA-WTO study estimates USD 47 billion economic output from FIFA Club World Cup and FIFA World Cup 2026. https://inside.fifa.com/organisation/media-releases/fifa-wto-study-estimates-usd-47-billion-economic-output-from-fifa-club-world
The Guardian. (2026, April 30). The $13 billion World Cup: How the numbers stack up on FIFA’s 2026 balance sheet. https://www.theguardian.com/football/ng-interactive/2026/apr/30/the-13bn-world-cup-how-the-numbers-stack-up-on-fifas-2026-balance-sheet
PanamericanWorld. (2025, May 6). FIFA World Cup 2026: A multi-billion dollar boost for North America. https://panamericanworld.com/en/magazine/homepage-sections/fifa-world-cup-2026-multi-billion-dollar-boost/
Smith College. (2026, June 11). 2026 World Cup: High costs for host cities. Interview with Andrew Zimbalist. https://www.smith.edu/news-events/news/2026-world-cup-high-costs-host-cities
Steakin, W. (2026, May 30). What the World Cup could mean for the US economy. ABC News. https://abcnews.com/Business/winners-losers-world-cup-us-economy/story?id=133414322